empty
 
 
27.10.2025 12:29 PM
EUR/USD Forecast on October 27, 2025
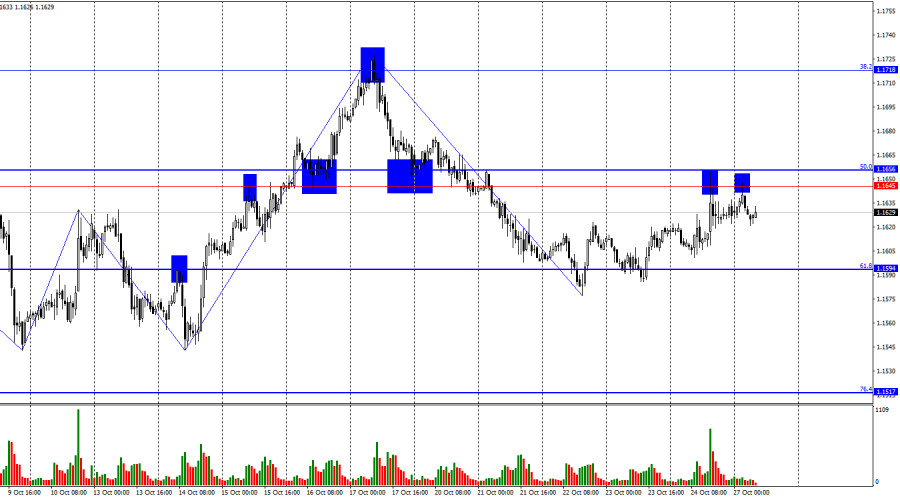
On Friday, the EUR/USD pair rose toward the resistance zone of 1.1645–1.1656 and bounced off it twice (including another bounce early Monday night). Thus, today a reversal in favor of the U.S. dollar may occur, and a new decline could begin toward the 61.8% retracement level at 1.1594. If the pair consolidates above the 1.1645–1.1656 level, the likelihood of further euro growth toward the next 38.2% Fibonacci level at 1.1718 will increase.

This image is no longer relevant

The wave situation on the hourly chart remains simple and clear. The last upward wave broke above the previous wave's peak, while the last downward wave failed to break the previous low. Therefore, the trend is currently bullish.

The latest labor market data, the changing outlook for the Fed's monetary policy, Trump's renewed aggression toward China, and the U.S. government shutdown are all supporting bullish traders. However, the bulls themselves continue to attack very sluggishly, as if unwilling to do so for reasons unknown.

On Friday, the information background was very strong and there were many economic reports released. However, traders once again surprised with their passivity. The bulls launched a new attack that ended after just 30–40 pips, near the 1.1645–1.1656 level. As the saying goes, they tried—but retreated at the first sign of resistance. And that was a mistake, since the news backdrop had supported the bulls more than once recently.

Business activity indices in the Eurozone and Germany showed positive dynamics; each index came in above traders' expectations. The U.S. inflation report was weaker than forecast—3.0% year-over-year in September. However, U.S. inflation continues to rise, as it was 2.9% the previous month. Thus, the Fed may temporarily set inflation aside and focus on supporting the U.S. labor market. This week, traders may expect monetary policy easing, which gives bulls yet another reason to be a bit more active.

This image is no longer relevant

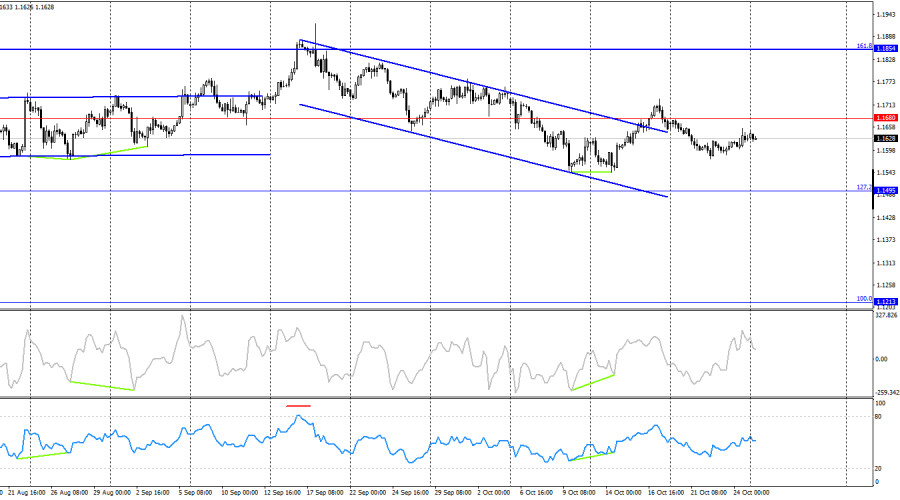
On the 4-hour chart, the pair turned in favor of the U.S. dollar and consolidated below the 1.1680 level, which allows for the expectation of some decline. However, earlier the pair had also consolidated above the descending trend channel after a bullish divergence formed on the CCI indicator. Thus, the upward movement may resume toward the next 161.8% retracement level – 1.1854. Market movements are very weak right now, so the analysis of the hourly chart seems more relevant.

Commitments of Traders (COT) Report

This image is no longer relevant

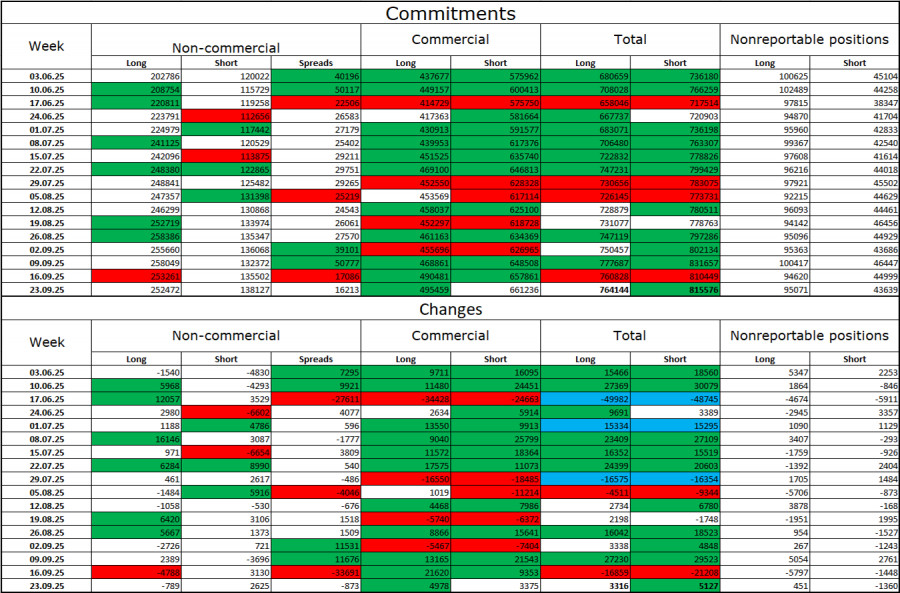
During the last reporting week, professional traders closed 789 long positions and opened 2,625 short positions. No new COT reports have been released for a month. The sentiment of the Non-commercial group remains bullish thanks to Donald Trump, and it continues to strengthen over time.

The total number of long contracts held by speculators now stands at 252,000, while short positions number 138,000—almost a twofold difference. In addition, note the number of green cells in the table above, which reflect a strong build-up of euro positions. In most cases, interest in the euro continues to grow, while interest in the dollar declines.

For thirty-three consecutive weeks, large traders have been reducing their short positions and increasing their longs. Donald Trump's policies remain the most significant factor for traders, as they could create numerous long-term, structural problems for the U.S. economy. Despite several major trade agreements being signed, many key economic indicators continue to decline.

News Calendar for the U.S. and Eurozone

Eurozone – German Business Climate Index (09:00 UTC)

On October 27, the economic calendar contains only one entry, but it is of little interest. The information background will have no impact on market sentiment on Monday.

EUR/USD Forecast and Trader Recommendations

Sales: possible today if the price rebounds from the 1.1645–1.1656 level on the hourly chart, targeting 1.1594. Purchases: can be considered if the pair closes above 1.1645–1.1656, targeting 1.1718.

The Fibonacci grids are built:

  • on the hourly chart between 1.1392–1.1919
  • and on the 4-hour chart between 1.1214–1.0179
Samir Klishi,
Analytical expert of InstaForex
© 2007-2025
Summary
Urgency
Analytic
Grigory Sokolov
Start trade
Earn on cryptocurrency rate changes with InstaForex
Download MetaTrader 4 and open your first trade
  • Grand Choice
    Contest by
    InstaForex
    InstaForex always strives to help you
    fulfill your biggest dreams.
    JOIN CONTEST
  • Chancy Deposit
    Deposit your account with $3,000 and get $1000 more!
    In October we raffle $1000 within the Chancy Deposit campaign!
    Get a chance to win by depositing $3,000 to a trading account. Having fulfilled this condition, you become a campaign participant.
    JOIN CONTEST
  • Trade Wise, Win Device
    Top up your account with at least $500, sign up for the contest, and get a chance to win mobile devices.
    JOIN CONTEST
  • 100% Bonus
    Your unique opportunity to get a 100% bonus on your deposit
    GET BONUS
  • 55% Bonus
    Apply for a 55% bonus on your every deposit
    GET BONUS
  • 30% Bonus
    Receive a 30% bonus every time you top up your account
    GET BONUS

Recommended Stories

Can't speak right now?
Ask your question in the chat.
Widget callback