empty
 
 
31.10.2025 11:30 AM
EUR/USD Forecast on October 31, 2025

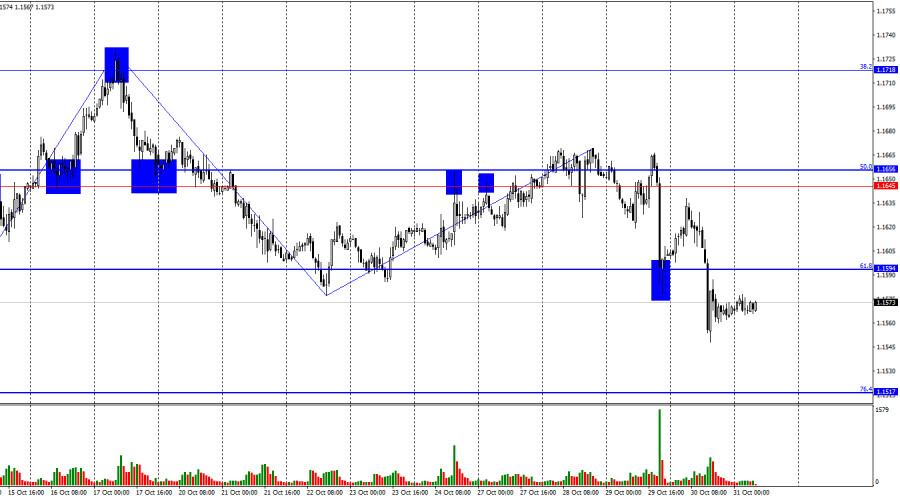
On Thursday, the EUR/USD pair rebounded from the 61.8% Fibonacci level at 1.1594, showed a brief upward movement, and then fell sharply, closing below 1.1594. Thus, today the decline in quotes may continue toward the next 76.4% corrective level at 1.1517. A consolidation above 1.1594 would allow traders to expect some growth of the euro toward the resistance level of 1.1645–1.1656.

This image is no longer relevant

The wave structure on the hourly chart remains simple and clear. The last completed upward wave failed to break the previous peak, while the last downward wave broke the prior low. Thus, the trend has once again turned bearish. Bullish traders once more failed to take advantage of opportunities for an advance, while the bears continued to attack — often driven purely by enthusiasm and without informational support.

On Wednesday evening, the results of the FOMC meeting became known. Despite a 0.25% rate cut, the U.S. dollar strengthened, a move that continued into Thursday under rather questionable informational conditions. Economic data on GDP, inflation, and unemployment released from the Eurozone and Germany could not have been the cause of the euro's fall. In fact, Eurozone GDP grew more strongly than expected, and almost all German reports matched trader forecasts.

I also cannot credit the U.S. dollar with any advantage from either the Fed or ECB meetings. All that became clear after the ECB meeting was that inflation is under control, certain economic risks persist, but overall the regulator is in a strong position regarding monetary policy. From the Fed, we only learned that the regulator remains fully dependent on economic data, which in October was scarcer than usual. Therefore, I didn't see anything on Wednesday or Thursday that could have fundamentally supported the bears.

This image is no longer relevant

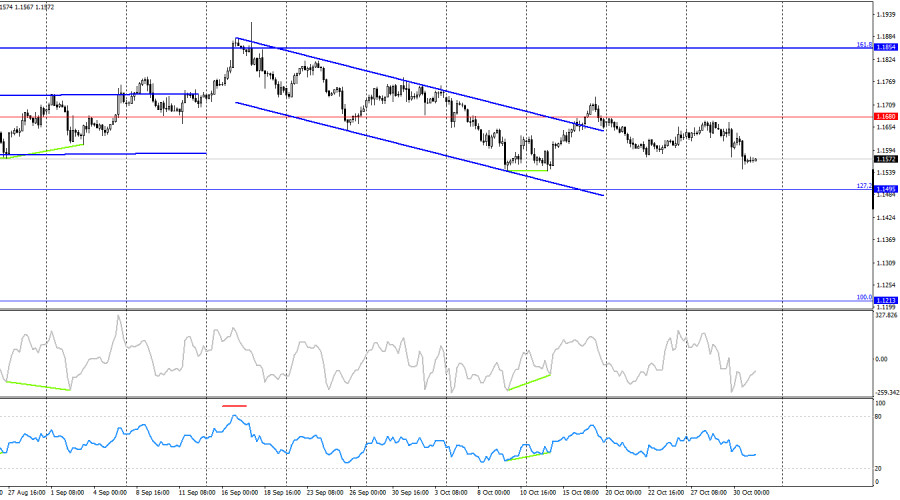
On the 4-hour chart, the pair made a reversal in favor of the U.S. dollar and consolidated below the 1.1680 level, which suggests the potential for further decline. However, earlier there was also a consolidation above the descending trend channel following the formation of a bullish divergence on the CCI indicator. Thus, the growth process could resume toward the next 161.8% corrective level at 1.1854. Market movements are weak at the moment, and I believe the hourly chart provides a more informative picture.

Commitments of Traders (COT) Report

This image is no longer relevant

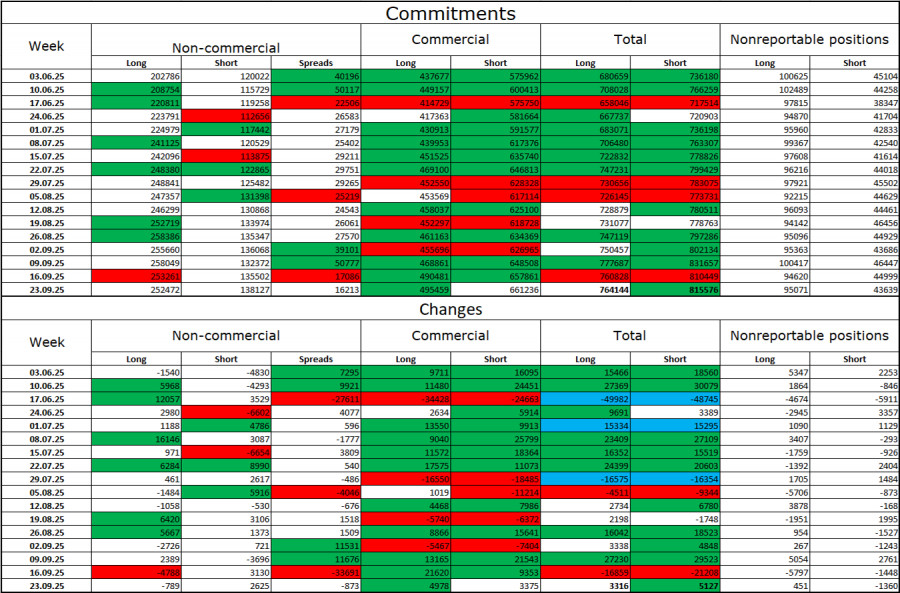
During the last reporting week, professional traders closed 789 long positions and opened 2,625 short positions. There have been no new COT reports for a month. The sentiment of the "non-commercial" group remains bullish, strengthened over time — largely thanks to Donald Trump. The total number of long positions held by speculators now stands at 252,000, compared with 138,000 short positions — almost a twofold difference.

Also, note the number of green cells in the table above — they indicate a strong buildup of long positions on the euro. In most cases, interest in the euro continues to rise, while interest in the dollar declines.

For thirty-three consecutive weeks, major market players have been reducing short positions and increasing long positions. Donald Trump's policy remains the most significant factor for traders, as it may cause numerous long-term structural problems for the U.S. economy. Despite several important trade agreements being signed, many key economic indicators continue to decline.

Economic Calendar for the U.S. and Eurozone

  • Eurozone – Retail Sales in Germany (07:00 UTC)
  • Eurozone – Consumer Price Index (10:00 UTC)

On October 31, the economic calendar contains two events worth attention. The news background's impact on market sentiment Friday morning may be moderate.

EUR/USD Forecast and Trader Recommendations

Sales were possible after the price closed below the 1.1645–1.1656 level on the hourly chart, with a target at 1.1594 — which has already been met. New sales can be considered after a close below 1.1594, with a target at 1.1517. These trades can be kept open today, with stop-loss moved to breakeven.

Buy positions may be considered on a rebound from 1.1517, with a target at 1.1594, or on a close above 1.1594, with a target at 1.1645.

Fibonacci grids are built between 1.1392–1.1919 on the hourly chart and 1.1214–1.0179 on the 4-hour chart.

Summary
Urgency
Analytic
Grigory Sokolov
Start trade
Gana con los cambios en el valor de las criptomonedas con InstaForex.
Descarga MetaTrader 4 y abre tu primera operación.
  • Grand Choice
    Contest by
    InstaForex
    InstaForex always strives to help you
    fulfill your biggest dreams.
    UNIRSE AL CONCURSO
  • Depósito al azar
    ¡Haga un depósito en su cuenta de $3,000 y obtenga $5000 más!
    ¡En Noviembre, sorteamos $5000 dentro de la campaña Depósito afortunado!
    Obtenga la oportunidad de ganar depositando $3,000 en una cuenta de operaciones. Tras haber cumplido esta condición, se convertirá en un participante de la campaña.
    UNIRSE AL CONCURSO
  • Opere de forma inteligente, gane un dispositivo
    Recargue su cuenta con al menos $500, regístrese en el concurso y tenga la oportunidad de ganar dispositivos móviles.
    UNIRSE AL CONCURSO
  • 100% de bonificación
    Su oportunidad única de obtener un bono del 100 % en su depósito
    OBTENER BONO
  • 55% de bonificación
    Solicite un bono del 55% en cada depósito
    OBTENER BONO
  • 30% de bonificación
    Reciba un bono del 30% cada vez que recargue su cuenta
    OBTENER BONO

Recommended Stories

¿No puede hablar ahora mismo?
Ingrese su pregunta en el chat.
Widget callback