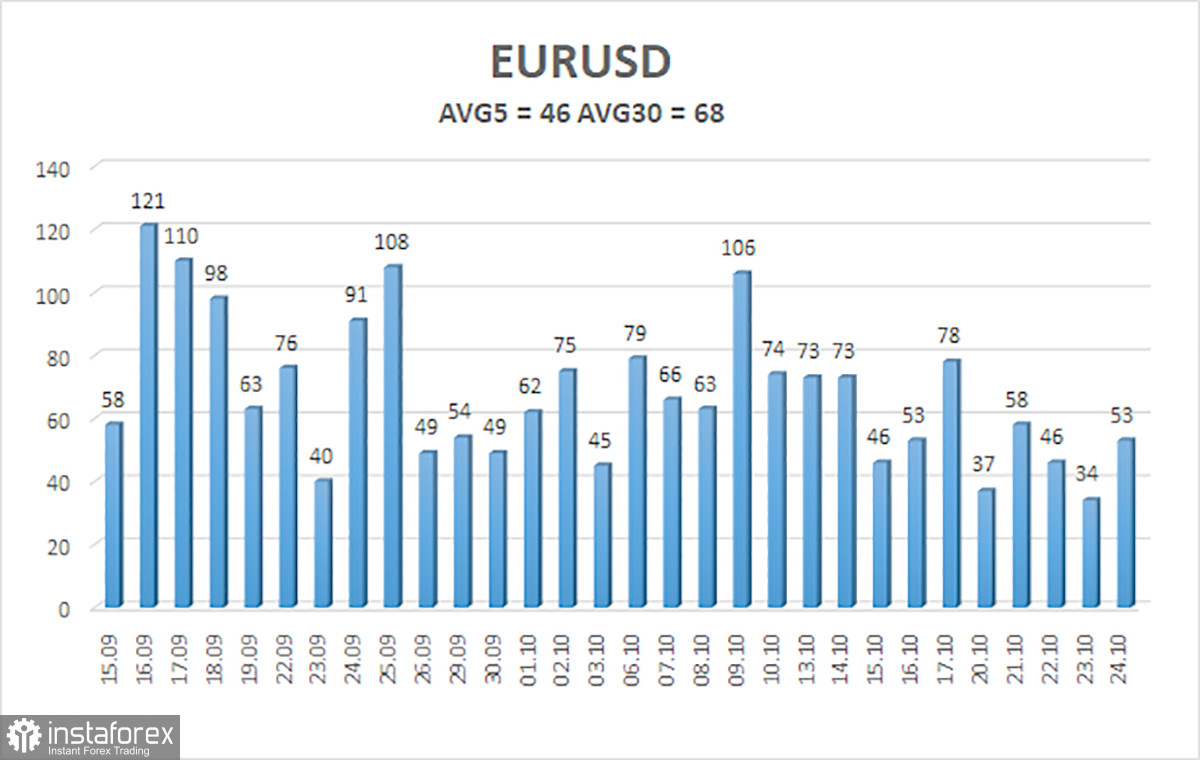
The EUR/USD currency pair demonstrated a volatility of 53 pips on Friday. In essence, this could be the end of the current article, as there are no significant movements in the market right now, and even fewer logical movements. The illustration below shows that the maximum daily volatility last week was 58 pips. On Friday, when the macroeconomic backdrop was quite abundant (and essentially the only day when any macroeconomic data was published), the volatility was 53 pips. Thus, the market is currently refusing to trade, regardless of the fundamental and macroeconomic context.
In recent weeks, we have consistently noted that movements in the currency market are illogical. It cannot be said that there were no news events at all over the past month. And these events have clearly not favored the U.S. dollar. However, the dollar is growing quite steadily, which creates serious discord in the analysis. Simply put, based on all indicators, the dollar should be falling right now, just as it did in the first half of the year. But instead, we have observed "American races" in slow motion for several months now. The market does not want to sell the dollar; it does not want to trade at all.
This is why we continue to emphasize the sideways trend on the daily timeframe. We believe this is the primary reason for the dollar's rise and the main driver of low volatility. It should be remembered that in a sideways trend, movements are always random. Major players use the sideways trend to either open or close positions. Consequently, movements within the sideways trend can vary widely, independent of macroeconomic or fundamental factors. This is precisely what we have seen in recent weeks.
Thus, the key question now is: when will the sideways trend end? Because as long as it continues, no events will be able to trigger the movements everyone is waiting for. Perhaps someone in the market believes the dollar should establish its trend, but such a move won't be seen until the sideways trend concludes.
This week, meetings of the European Central Bank and the Federal Reserve are scheduled. These two events can be considered key. Let's break down the ECB's meeting. There is a 100% probability that the key interest rate will remain unchanged, as there are no grounds for cutting it at this time. Inflation in the Eurozone has been rising over recent months, but not enough to warrant discussing monetary policy tightening. Therefore, it is likely that we will not hear any "loud" statements from Christine Lagarde, who has spoken at least 10 times in the last month. Thus, there is a 90% likelihood that the ECB meeting will be completely "pass-through." Once again, this week's focus will be on the sideways trend on the daily timeframe. How to trade in this situation should be determined by traders themselves.
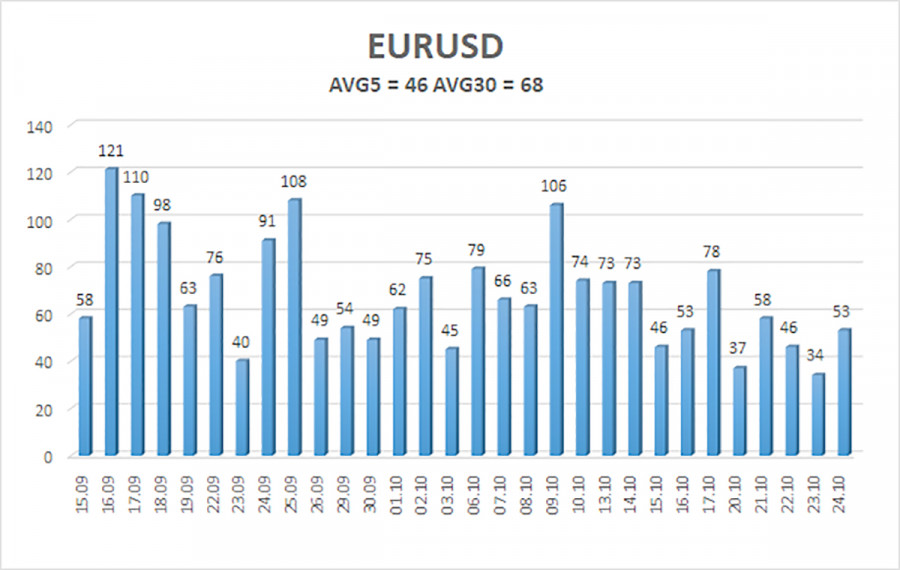
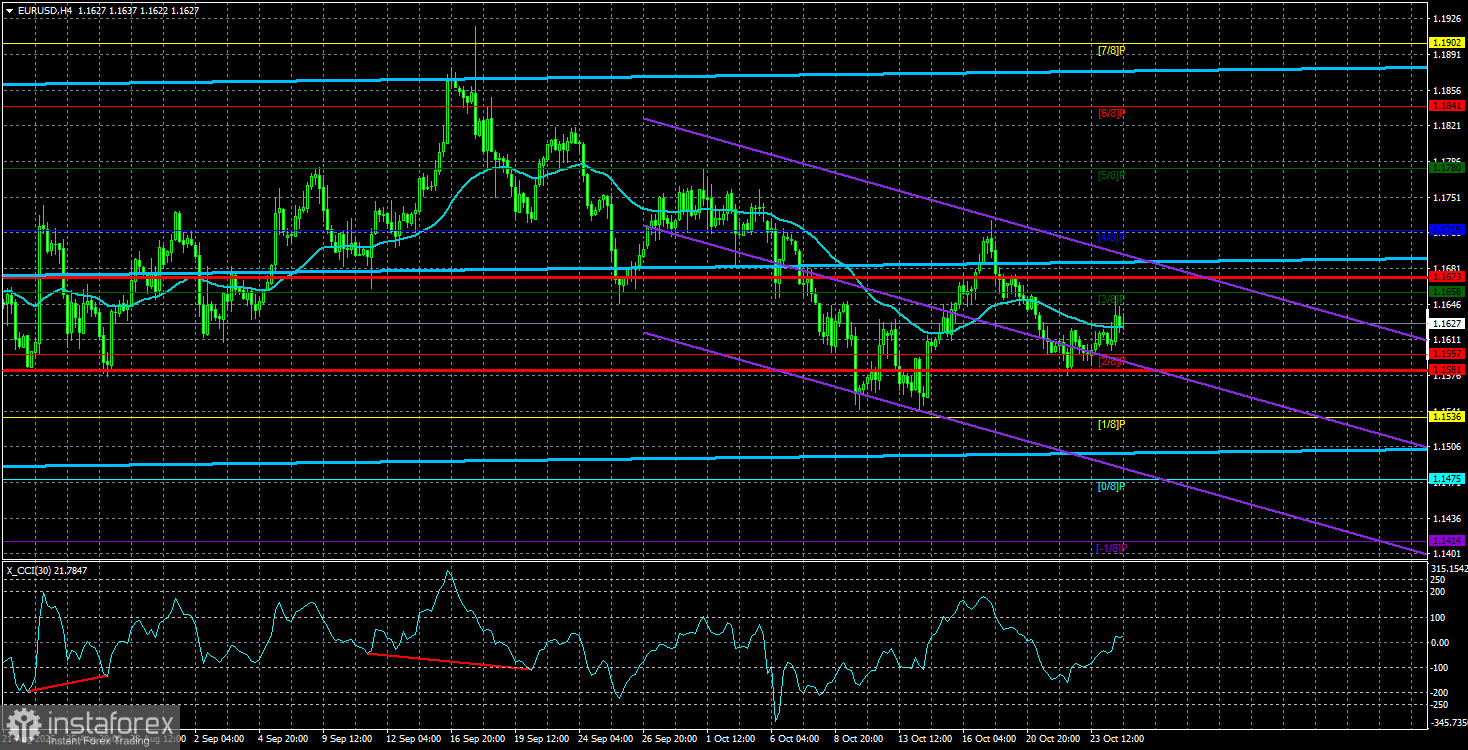
The average volatility of the EUR/USD currency pair over the last five trading days, as of October 27, is 46 pips, which is characterized as "average." We expect the pair to move between levels 1.1581 and 1.1673 on Monday. The upper channel of the linear regression is pointing upwards, indicating a bullish trend. The CCI indicator has entered the oversold territory, which may prompt a new uptrend.
Nearest Support Levels:
- S1 – 1.1597
- S2 – 1.1536
- S3 – 1.1475
Nearest Resistance Levels:
- R1 – 1.1658
- R2 – 1.1719
- R3 – 1.1780
Trading Recommendations:
The EUR/USD pair is attempting to restart its upward trend in 2025, and its long-term prospects have not changed. Donald Trump's policies continue to exert strong pressure on the dollar, so we do not anticipate the U.S. currency appreciating. Consequently, long positions with targets at 1.3672 and 1.3733 remain much more relevant while the price is above the moving average. If the price is below the moving average line, small shorts can be considered with targets at 1.1581 and 1.1536 on purely technical grounds. Occasionally, the U.S. currency shows corrections, but for a trend to strengthen, real signs of a resolution in the trade war or other global positive factors are needed.
Explanations for Illustrations:
- Linear regression channels help determine the current trend. If both are directed in the same way, it indicates a strong trend.
- The moving average line (settings 20,0, smoothed) defines the short-term trend and the direction in which trading should currently be conducted.
- Murray levels are target levels for movements and corrections.
- Volatility levels (red lines) indicate the probable price channel in which the pair will trade over the next day, based on current volatility indicators.
- The CCI indicator: its entry into the oversold area (below -250) or the overbought area (above +250) indicates that a trend reversal in the opposite direction is approaching.