EUR/USD 5M Analysis
On Wednesday, the EUR/USD pair continued moving within a weak downward channel, as previously forecast. However, volatility dropped to a minimum, there was no macroeconomic backdrop for the third consecutive day, and the market ignored the numerous tariff announcements made by Donald Trump.
The first point to clarify in this analysis: Trump's tariffs have not yet been implemented or raised. Yes, the U.S. president has once again threatened to increase tariffs—this time on copper, pharmaceuticals, and several other product categories. He had previously raised tariffs for 15 countries on his "blacklist." However, the new tariffs for trade partners are only set to take effect on August 1, and Trump could still change his stance several times before then. As for sectoral tariffs, Trump has so far only expressed his intention to raise them, without specifying a timeline. Therefore, first, there's no reason for panic, and second, there's nothing to trade off just yet.
We continue to believe that the U.S. dollar has no real potential for substantial growth in the near future, and the pair's movement over the past week and a half confirms this view. The dollar is rising purely on technical grounds; the downward movement is very weak, and last week the market ignored strong U.S. labor and unemployment data.
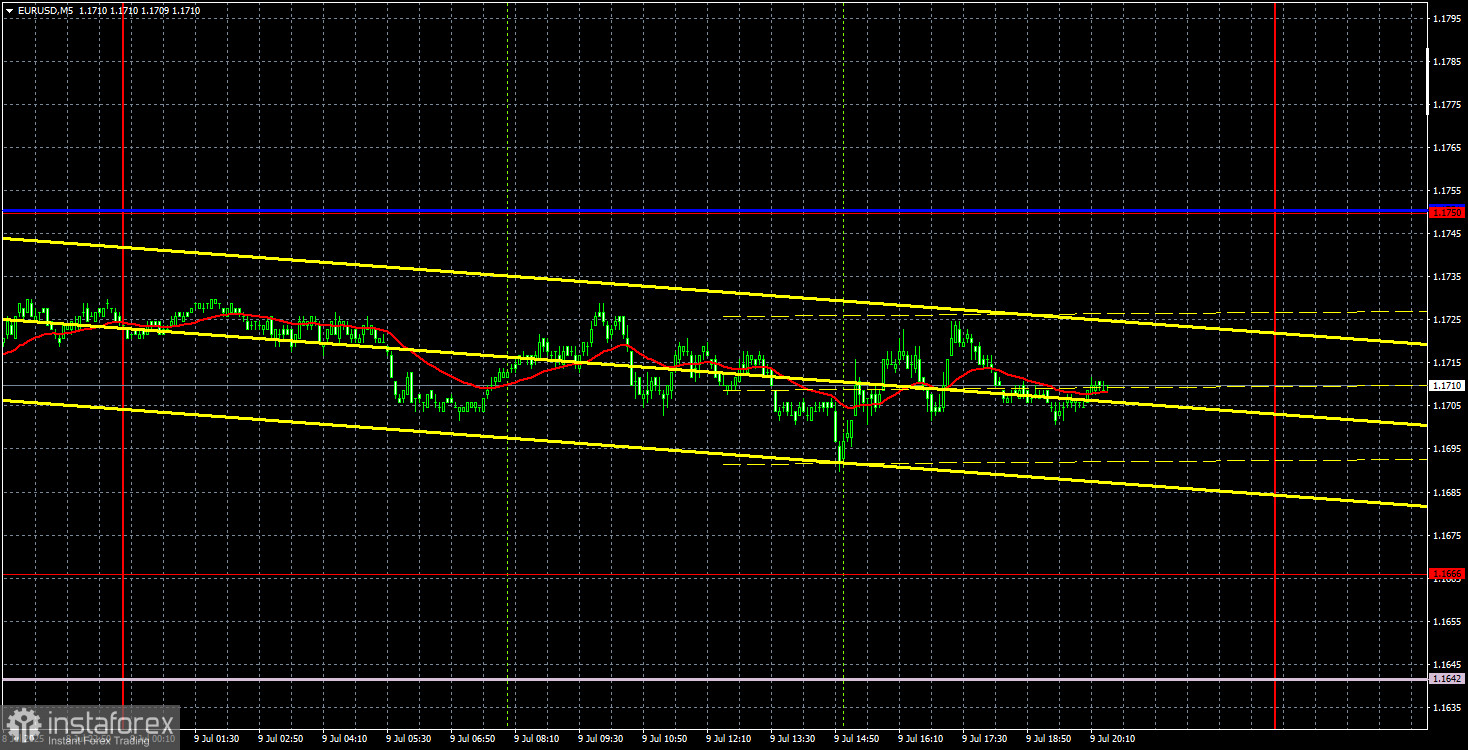
In the 5-minute time frame, there were no trading signals on Wednesday. The price did not approach any key levels or lines, and volatility amounted to just 40 points.
COT Report
The latest COT report is dated July 1. The illustration above clearly shows that the net position of non-commercial traders had been bullish for an extended period. Bears only managed to gain an advantage at the end of 2024, and even then, they quickly lost it. Since Trump took office, the dollar has been in decline. While we can't say with 100% certainty that the dollar will continue to fall, current global developments point in that direction.
We still don't see any fundamental drivers for strengthening the euro. However, there remains one very significant factor supporting a continued decline in the U.S. dollar. The global downtrend is still in place—but at this point, how much does it really matter where the price has been moving over the last 16 years? The dollar could begin rising once Trump ends his trade wars—but will he? And when?
At the moment, the red and blue lines have crossed again, which means the trend remains bullish. During the last reporting week, the number of long positions held by the "Non-commercial" group increased by 1.2 thousand, while short positions grew by 4.8 thousand. As a result, the net position decreased by 3.6 thousand contracts over the week.
EUR/USD 1H Analysis
On the hourly time frame, the EUR/USD pair maintains a downward trend, supported by a descending channel. Thus, the dollar may continue to appreciate for a short while, but its longer-term outlook appears grim once again. U.S. news continues to flood the market, effectively signaling to traders to move away from the dollar. Donald Trump's policy continues to undermine the dollar's status as a global reserve currency. The current movement in the pair appears to be nothing more than a technical correction. A breakout above the descending channel would provide technical grounds for expecting renewed euro growth.
Trading Levels for July 10:
1.1092, 1.1147, 1.1185, 1.1234, 1.1274, 1.1362, 1.1426, 1.1534, 1.1615, 1.1666, 1.1750, 1.1846–1.1857, as well as the Senkou Span B line (1.1642) and the Kijun-sen line (1.1741). Note: Ichimoku indicator lines can shift during the day, which should be considered when identifying trading signals.
Important: Don't forget to place a Stop Loss at breakeven if the price moves in the correct direction by 15 points. This will help protect against losses in case of a false signal.
On Thursday, the EU will publish the first relatively important report of the week, which is unlikely to influence the pair's movement. Germany's inflation figures are certainly of interest, but inflation has stabilized around 2% in recent months, meaning it no longer has much impact on ECB decisions. Moreover, ECB policy decisions currently have little effect on the euro, as the dollar has been steadily declining for six consecutive months.
Chart Legend:
- Thick red lines – resistance and support levels where price movement may stall. Not direct trading signals.
- Kijun-sen and Senkou Span B lines – key Ichimoku indicator lines, transferred from the 4-hour to the 1-hour time frame.
- Thin red lines – previous high/low levels where price previously bounced. These may serve as trading signals.
- Yellow lines – trendlines, channels, and other technical patterns.
- Indicator 1 on COT charts – net position size for each trader category.