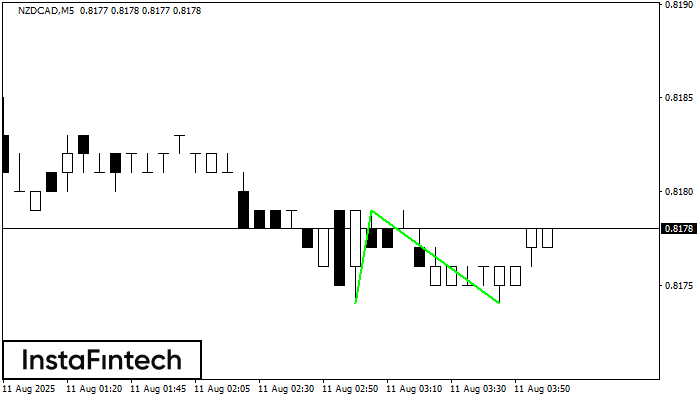
was formed on 11.08 at 03:00:24 (UTC+0)
signal strength 1 of 5
signal strength 1 of 5

The Double Bottom pattern has been formed on NZDCAD M5. This formation signals a reversal of the trend from downwards to upwards. The signal is that a buy trade should be opened after the upper boundary of the pattern 0.8179 is broken. The further movements will rely on the width of the current pattern 5 points.
The M5 and M15 time frames may have more false entry points.
Figure
Instrument
Timeframe
Trend
Signal Strength


