empty
06.11.2023 06:29 AM
BITCOIN: Technical analysis of the situation

Bitcoin

This image is no longer relevant

Higher timeframes

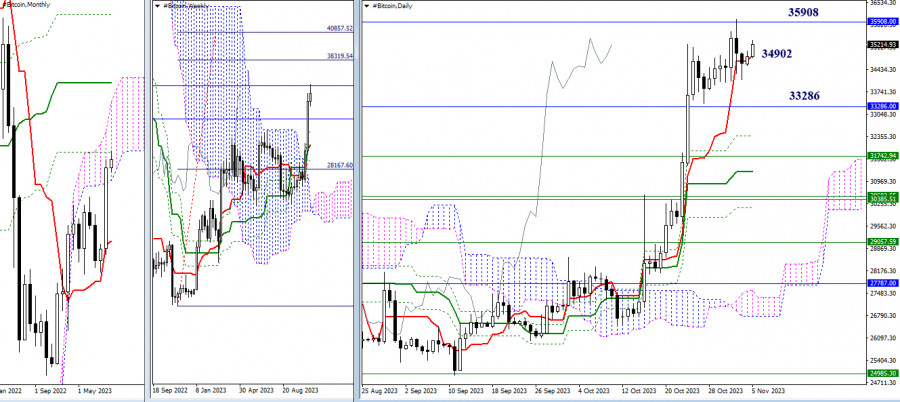
October provided bulls with moments of optimism, pushing the market away from the support of the monthly short-term trend towards the next resistance of the monthly death cross (35,908). Meanwhile, Bitcoin managed to close October within the monthly cloud (33,286), making the upper boundary of the Ichimoku cloud (40,490) the next upward target on this timeframe.

The result of October's activity was also the formation of an upward target for breaking the weekly cloud (38,320 - 40,858). These target levels (38,320 - 40,490 - 40,858) have been planned by the bullish players for November following the optimism and activity of October. This will only be possible if the bulls maintain and continue the October sentiment.

If priorities change and the bears return to the market. In that case, their focus will first be on exiting the monthly cloud (33,286) and then testing and liquidating the existing golden crosses of Ichimoku on the weekly and daily timeframes. The nearest supports from the golden crosses of Ichimoku at the moment can be noted at 32,380 - 31,743 - 31,261.

This image is no longer relevant

H4 - H1

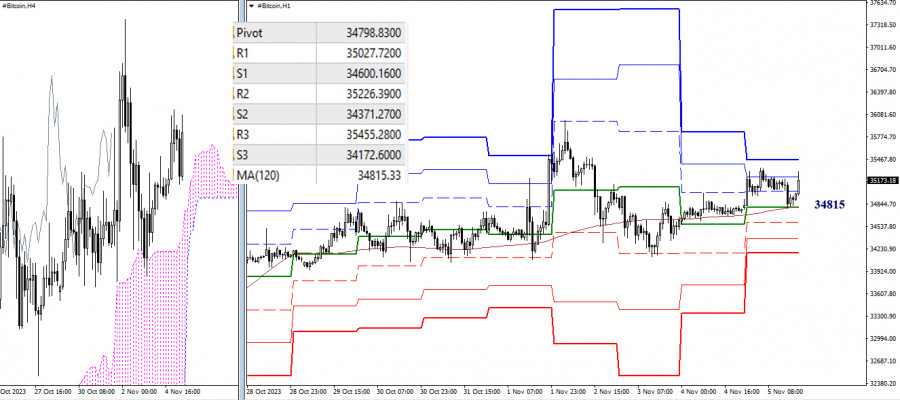
As of writing, the main advantage on the lower timeframes remains with the bullish players. However, the balance of power is very fragile because the weekly long-term trend (34,815) has been acting as support for a long time, responsible for the distribution and balance of power. Bitcoin can lose this support at any moment, after which the market's attention will shift within the day to the supports of the classic pivot points. The primary priority in this case will be the strengthening of bearish sentiments.

Note that the loss of the key level of the lower timeframes—34,815 (weekly long-term trend), is currently associated with losing the center of attraction of the daily timeframe—34,902 (short-term trend). A secure consolidation below 34,902 - 34,815 opens up new prospects for bears, both within the day and on the higher timeframes.

***

The technical analysis of the situation uses:

Higher timeframes - Ichimoku Kinko Hyo (9.26.52) + Fibo Kijun levels

H1 - Pivot Points (classic) + Moving Average 120 (weekly long-term trend)

Summary
Urgency
Analytic
Zhizhko Nadezhda
Start trade
รับผลกำไรจากการเปลี่ยนแปลงอัตราสกุลเงินดิจิทัลกับ InstaForex.
ดาวน์โหลด MetaTrader 4 และเปิดการซื้อขายครั้งแรกของคุณ.
การปรับลดอัตราดอกเบี้ยของเฟดและความก้าวหน้าในวิกฤตยูเครนที่จะส่งผลดีต่อตลาดการเงิน (ความเป็นไปได้ที่ Bitcoin และ #USDX จะลดลง) รายงานอัตราเงินเฟ้อที่เผยแพร่เมื่อวันอังคาร ได้เสริมความคาดหวังของผู้เข้าร่วมตลาดว่า ธนาคารกลางสหรัฐฯ จะปรับลดอัตราดอกเบี้ยในการประชุมเดือนกันยายน เปิดทางให้การเติบโตของตลาดหุ้นดำเนินต่อไป เริ่มกันที่รายงาน รายงานเงินเฟ้อผู้บริโภคของสหรัฐฯ ที่เผยแพร่เมื่อวานนี้แสดงให้เห็นว่า แม้จะมีความปั่นป่วนเนื่องจากสงครามภาษีของโดนัลด์ ทรัมป์ แต่เงินเฟ้อต่อปีคงตัวอยู่ที่ 2.7% ในขณะที่ตัวเลขรายเดือนลดลงตามที่คาดการณ์ ใช่แล้ว เงินเฟ้อพื้นฐานเพิ่มขึ้น
  • Grand Choice
    Contest by
    InstaForex
    InstaForex always strives to help you
    fulfill your biggest dreams.
    เข้าร่วมการแข่งขัน


บทความแนะนำ

XAU/USD ยังคงอยู่ภายใต้แรงกดดัน แม้ว่าศักยภาพในการแข็งค่าจะมีจำกัด วันพุธที่ 13 สิงหาคม 2025

[XAU/USD] – [วันพุธที่ 13 สิงหาคม 2025] XAU/USD ดูเหมือนกำลังพยายามทดสอบระดับแนวรับที่ใกล้ที่สุด ซึ่งได้รับการยืนยันโดยตัวบ่งชี้ RSI (14) ที่อยู่ในพื้นที่ Neutral-Bearish และทั้งสอง

Arief Makmur 08:25 2025-08-13 UTC+2

แม้ว่าจะมีความเป็นไปได้ในการปรับฐานลง แต่ AUD/USD ยังคงมีแนวโน้มแข็งแกร่ง วันพุธที่ 13 สิงหาคม 2025

[AUD/USD] – [วันพุธที่ 13 สิงหาคม 2025] สำหรับตำแหน่งของ AUD/USD ขณะนี้ EMA(50) ยังคงอยู่เหนือระดับ EMA(200) อีกทั้ง RSI (140)

Arief Makmur 08:25 2025-08-13 UTC+2

การพยากรณ์ EUR/USD สำหรับวันที่ 13 สิงหาคม 2025

เมื่อวานนี้ ยูโรได้พยายามทดสอบแนวต้านเส้นสมดุลอีกครั้ง ครั้งนี้มีการสนับสนุนจากตลาดภายนอก — ดัชนี S&P 500 เพิ่มขึ้น 1.14% และได้สร้างจุดสูงสุดใหม่ตลอดกาล อย่างไรก็ตาม ยูโรยังไม่รีบเร่ง — ยังไม่มีการทะลุกรอบออกไปเนื่องจากใกล้จะถึงช่วงเวลา Fibonacci

Laurie Bailey 05:00 2025-08-13 UTC+2

การคาดการณ์ GBP/USD สำหรับวันที่ 13 สิงหาคม 2025

เมื่อวานนี้ เงินปอนด์อังกฤษได้ใช้ประโยชน์จากความอ่อนแอชั่วคราวของดอลลาร์อย่างเต็มที่ โดยไปถึงระดับกลางที่ 1.3525 ตัววัดมาร์ลินกำลังเพิ่มขึ้นในเขตแนวโน้มขาขึ้น และตอนนี้ราคาจำเป็นต้องสร้างฐานเหนือระดับของเมื่อวานนี้เพื่อเปิดทางไปยังเป้าหมายที่ 1.3631 (สูงสุดของวันที่ 13 มิถุนายน) หรือสูงกว่าเล็กน้อย — ไปทางเส้น MACD อย่างไรก็ตาม

Laurie Bailey 05:00 2025-08-13 UTC+2

การพยากรณ์ราคาซิลเวอร์สำหรับวันที่ 13 สิงหาคม 2025

เมื่อวานนี้ ราคาซิลเวอร์เพิ่มขึ้น 0.41% ราคากลับขึ้นมาอยู่เหนือเส้นตัวชี้วัดสมดุล และ Marlin oscillator ซึ่งใกล้เคียงที่จะเคลื่อนเข้าสู่ดินแดนแนวโน้มขาขึ้น อาจจะเข้าร่วมในช่วงการเติบโตเร็วๆ นี้ การทะลุแนวต้านที่ระดับ 38.258 ซ้ำๆ อาจประสบความสำเร็จมากกว่าความพยายามที่ยังลังเลเมื่อวันที่

Laurie Bailey 04:59 2025-08-13 UTC+2

สัญญาณการซื้อขายสำหรับ GOLD (XAU/USD) ช่วงวันที่ 12-15 สิงหาคม 2025: ซื้อเมื่อราคาสูงกว่า $3,341 หรือขายเมื่อราคาต่ำกว่า $3,335 (21 SMA - 200 EMA)

ถ้าทองคำลดลงต่ำกว่า 3,340 แนวโน้มอาจจะเป็นลบ แล้วมันอาจจะกลับมาเคลื่อนที่ลงอีกครั้ง และอาจคาดการณ์ได้ว่าเครื่องมือนี้จะถึง 5/8 ของ Murray ที่ 3,320 และสุดท้าย 4/8 ของ Murray ที่

Dimitrios Zappas 13:34 2025-08-12 UTC+2

สัญญาณการซื้อขายสำหรับ EUR/USD วันที่ 12-15 สิงหาคม 2025: ขายต่ำกว่า 1.1647 (200 EMA - 7/8 Murray)

ยูโรกำลังซื้อขายอยู่ประมาณ 1.1618 ซึ่งสูงกว่า 200 EMA และสูงกว่า 6/8 มาร์เรย์ กำลังฟื้นตัวจากการขาดทุนของวันก่อนแต่มีสัญญาณของความอ่อนล้า หากยูโรยังคงปรับตัวสูงขึ้นในอีกไม่กี่ชั่วโมงข้างหน้า อาจจะเผชิญกับแรงต้านที่แข็งแกร่งบริเวณระดับ 7/8 มาร์เรย์ ซึ่งอยู่ที่ 1.1657

Dimitrios Zappas 13:34 2025-08-12 UTC+2

XAU/USD. การวิเคราะห์และพยากรณ์

จากมุมมองทางเทคนิค ราคาทองคำยังคงสามารถยืนเหนือค่าเฉลี่ยเคลื่อนที่อย่างง่าย (SMA) 200 ช่วงในกราฟ 4 ชั่วโมงได้ ซึ่งทำหน้าที่เป็นระดับแนวรับสำคัญ เมื่อดูจากตัวกำหนดทิศทางในกราฟเดียวกันที่อยู่ในแดนลบแล้ว การหลุดต่ำกว่าระดับนี้ชัดเจนจะเปิดทางให้ทองคำลงไปสู่แนวรับระหว่างที่ 3315 ดอลลาร์ ตามด้วยระดับจิตวิทยาที่สำคัญที่ 3300 ดอลลาร์

Irina Yanina 12:57 2025-08-12 UTC+2

การคาดการณ์สำหรับ EUR/USD ในวันที่ 12 สิงหาคม 2025

ในวันจันทร์ คู่เงิน EUR/USD ลดลงถึงระดับ Fibonacci retracement 50.0% ที่ 1.1590 และมีการดีดตัวกลับ เมื่อเกิดการกลับทิศทางในนามศักดิ์สิทธิ์ของยูโรนี้ขึ้นแล้ว การเคลื่อนไหวขึ้นอาจต่อเนื่องไปถึงโซนแนวต้านที่ 1.1637–1.1645 หากสามารถรวมตัวสูงกว่าโซนนี้ได้ จะส่งเสริมการเติบโตต่อไปยังระดับ

Samir Klishi 11:46 2025-08-12 UTC+2

การคาดการณ์สำหรับ GBP/USD ในวันที่ 12 สิงหาคม 2025

ในกราฟรายชั่วโมงของ GBP/USD เมื่อวันจันทร์ที่ผ่านมา ลดลงไปยังบริเวณแนวรับที่ 1.3416–1.3425 และกลับทิศทางใกล้บริเวณดังกล่าวในความโปรดปรานของปอนด์ ซึ่งทำให้เกิดการเคลื่อนไหวขาขึ้นใหม่ไปสู่ระดับการปรับฐาน 76.4% ที่ 1.3482 การยืนเหนือระดับนี้อาจเพิ่มโอกาสในการเติบโตต่อไปยังระดับ Fibonacci ถัดไปที่ 100.0% ที่

Samir Klishi 11:23 2025-08-12 UTC+2
หากไม่สะดวกคุยในตอนนี้
ระบุคำถามไว้ได้ใน แชท.
Widget callback
 

Dear visitor,

Your IP address shows that you are currently located in the USA. If you are a resident of the United States, you are prohibited from using the services of InstaFintech Group including online trading, online transfers, deposit/withdrawal of funds, etc.

If you think you are seeing this message by mistake and your location is not the US, kindly proceed to the website. Otherwise, you must leave the website in order to comply with government restrictions.

Why does your IP address show your location as the USA?

  • - you are using a VPN provided by a hosting company based in the United States;
  • - your IP does not have proper WHOIS records;
  • - an error occurred in the WHOIS geolocation database.

Please confirm whether you are a US resident or not by clicking the relevant button below. If you choose the wrong option, being a US resident, you will not be able to open an account with InstaForex anyway.

We are sorry for any inconvenience caused by this message.