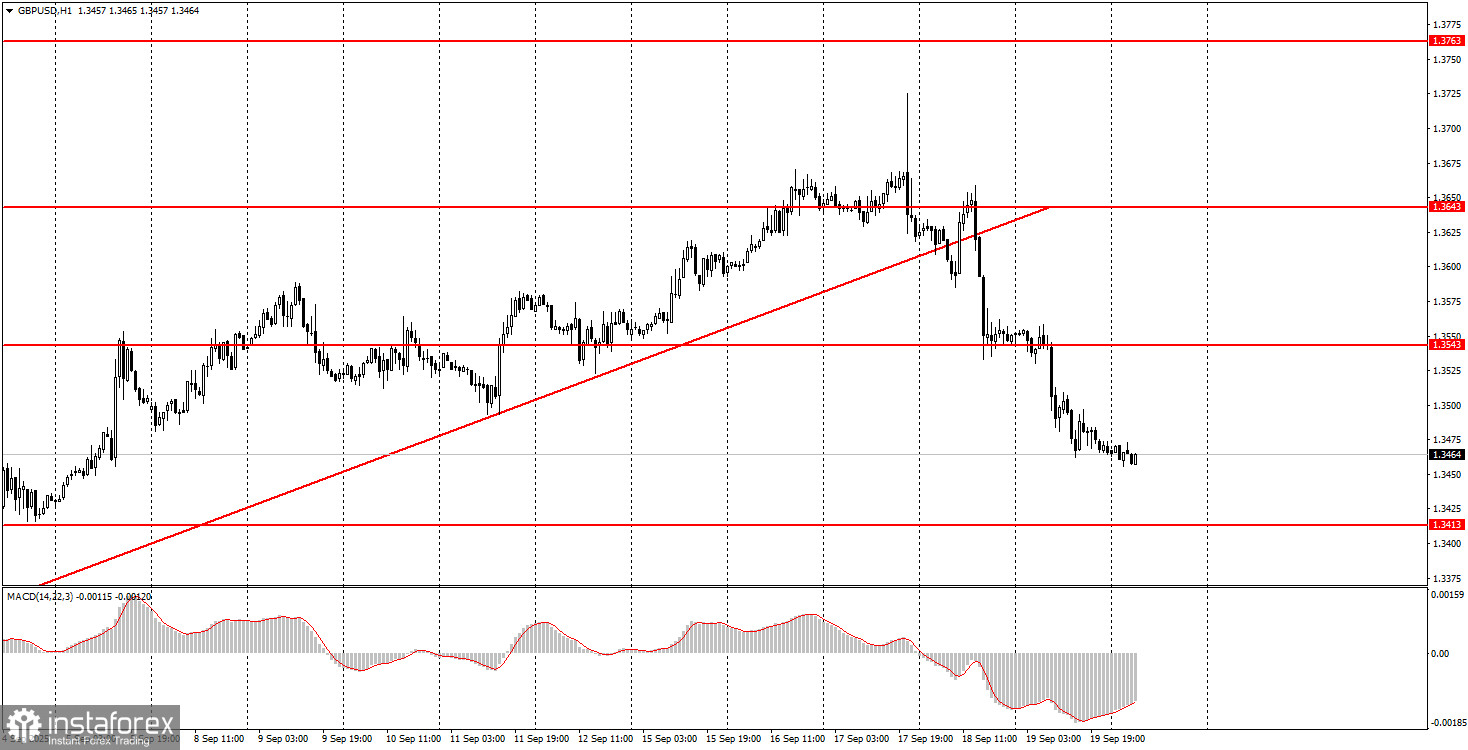
Friday Trade Analysis:1H chart of GBP/USD
The GBP/USD pair continued its downward movement on Friday, even though a rise in the pound would have been more logical. Let's recall that on Friday morning, the UK released a fairly positive retail sales report, which traders completely ignored. Overall, last week's economic statistics in the UK were quite solid, but it didn't prevent the pound from falling due to renewed concerns over the national budget. The pound has declined not because of the Fed or Bank of England meetings, but due to more budget-related issues. From our point of view, this factor has already been priced in—how long can the market keep selling off the pound based on a single, fairly localized concern? However, one must understand that market makers may have a different opinion. In any case, we rely on technical analysis, which visualizes the current situation on the market. At this time, the short-term trend is downward, so short positions are preferred. It's also worth noting that the price consolidated below the 1.3466–1.3475 level, which opens the way for new short trades.
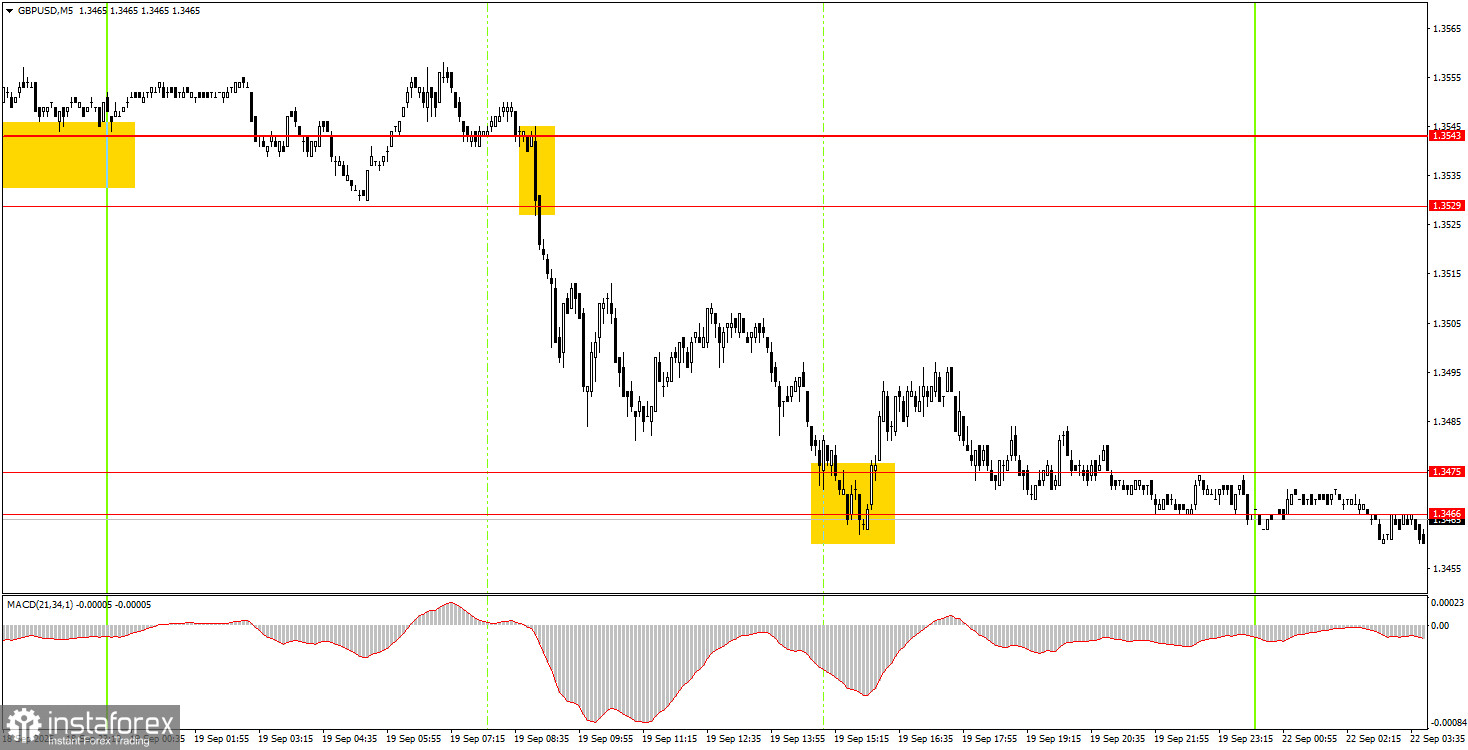
5M chart of GBP/USD
On the 5-minute time frame, a very good sell signal was generated on Friday—at a time when traders expected a rise. Nevertheless, the signal allowed for entering short positions. By the start of the U.S. session, the nearest target zone at 1.3466–1.3475 had been reached, so profits could have been locked in. A bounce off this zone also suggested potential buy entries, but that signal turned out to be false.
How to Trade on Monday:
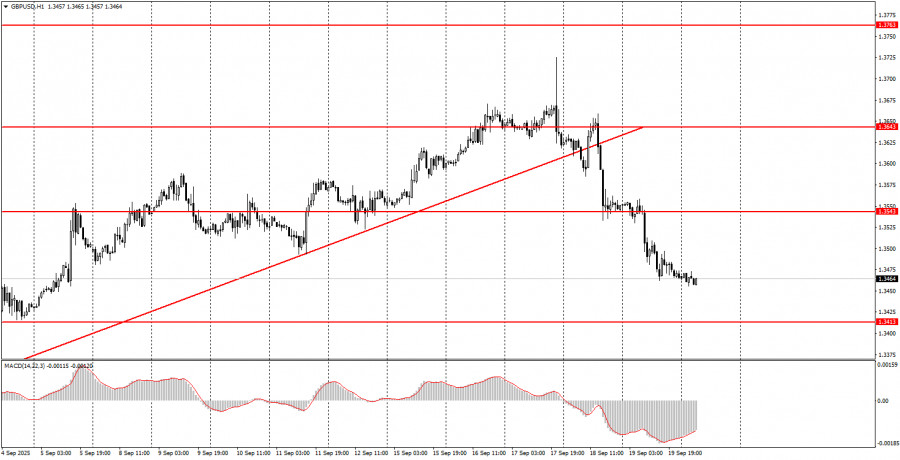
On the hourly chart, the GBP/USD pair has consolidated below the trend line, which points to a potential new technical correction after several weeks of upward movement. As we've mentioned before, we see no valid grounds for a medium-term rally of the U.S. dollar, so in the medium term we continue expecting movement to the upside. The daily chart clearly shows the current trend.
On Monday, the GBP/USD pair may continue to decline. A consolidation below the 1.3466–1.3475 area would allow for opening new short positions with a target at 1.3413–1.3421. A consolidation above that area would permit opening long positions with a target at 1.3529–1.3543.
On the 5-minute chart, trading can currently be based on the following levels:1.3102–1.3107, 1.3203–1.3211, 1.3259, 1.3329–1.3331, 1.3413–1.3421, 1.3466–1.3475, 1.3529–1.3543, 1.3574–1.3590, 1.3643–1.3652, 1.3682, 1.3763.
On Monday, speeches are scheduled in the UK from Bank of England Chief Economist Huw Pill and Bank of England Governor Andrew Bailey. We believe both Pill and Bailey may share new, important market-moving information—particularly concerning the budget for the next fiscal year.
Main Rules of the Trading System:
- Signal strength is determined by how long it takes to form (a bounce or breakout). The less time it takes, the stronger the signal.
- If there have already been two or more false signals generated near a level, all subsequent signals from that level should be ignored.
- In a flat market, any pair can generate a lot of false signals or none at all. In any case, trading should stop at the first signs of sideways price action.
- Trades should be opened between the start of the European session and the middle of the U.S. session. All trades should be closed manually after this period.
- On the hourly timeframe, MACD signals are best used only when there is good volatility and a trend confirmed by a trend line or channel.
- If two levels are too close together (between 5 and 20 points), consider them as a support or resistance area rather than individual levels.
- Once the price goes 20 points in the correct direction, the Stop Loss should be moved to breakeven.
What's on the chart:
- Support and resistance price levels are the targets when opening buy or sell trades. Take Profit levels can be set around them.
- Red lines are channels or trend lines showing the current trend and indicating the preferred trading direction.
- MACD indicator (14,22,3) – histogram and signal line – is an auxiliary indicator that can also be used as a signal source.
Important speeches and reports (always listed in the news calendar) can significantly impact the movement of a currency pair. During such events, it's recommended to trade with maximum caution or exit the market altogether to avoid sharp price reversals against the preceding trend.
Forex market beginners should remember that not every trade can be profitable. Developing a clear strategy and sound money management are the keys to long-term success in trading.