empty
 
 
11.09.2025 03:56 AM
EUR/USD Overview. September 11. What to Expect from US Inflation?

This image is no longer relevant

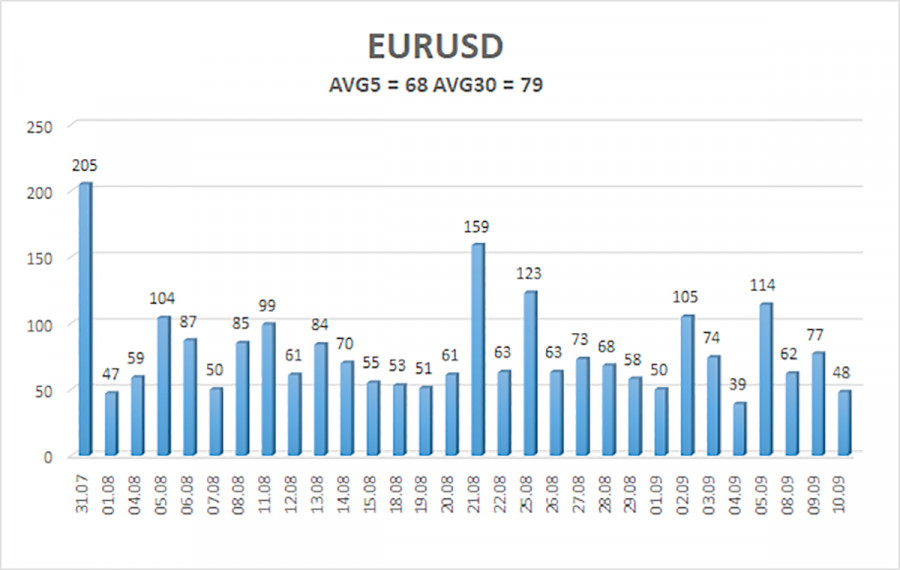
The EUR/USD currency pair traded very quietly on Wednesday, as it has for most of the past few months. The chart below highlights that euro volatility has rarely exceeded 70-75 pips per day. That's not low, but not particularly high either. In addition, in the last month, we've seen movements that are very similar to a sideways flat. Despite a mild upward bias and the dollar's inability to even stage a meaningful correction, the price mainly remained between 1.1597 and 1.1719. Last Friday, prices broke out of this stubborn range, but by the start of the week, they had already returned to it.

And, inexplicably, they returned to this range even though Tuesday saw the release of the annual NonFarm Payrolls report, which is obviously more important than the monthly figure. For four months in a row, the monthly data have disappointed, and now the annual number has as well. However, instead of the expected dollar fall, we saw growth. Such illogical behavior suggests something is not quite right in the market at the moment.

Today, another important US inflation report will be released. In our view, it will have little effect, as the Fed urgently needs to rescue the labor market. Traders—and probably the Fed itself—had hopes for the labor and unemployment reports at the beginning of September, but as we've seen, they did not pan out. Thus, the rate will be cut at the September 17 meeting regardless.

Could it be cut by 0.5% at once? Today's inflation report is precisely what's needed to answer that. If, without warning, the Consumer Price Index abruptly slows for August, this will be a strong argument in favor of an immediate half-point cut. But that's only at first glance. Even then, US inflation would remain above the Fed's target, and further deceleration would be questionable given Donald Trump's ever-escalating trade war.

If US inflation accelerates, or accelerates beyond forecasts, it still won't change anything. Even if inflation is sky-high, the Fed can't abandon the labor market. Most likely, we'll see the two rate cuts by year-end that have been discussed since the start of the year.

It's safe to assume that markets have long since priced in these two cuts. In reality, the entire monetary easing cycle may have already been priced in, as the dollar followed a 17-year trend during 2022–2024 while US inflation was declining. This "mess" only ended with the arrival of Trump. Now, Trump himself has no interest in restoring the dollar's stability and appeal to investors.

This image is no longer relevant

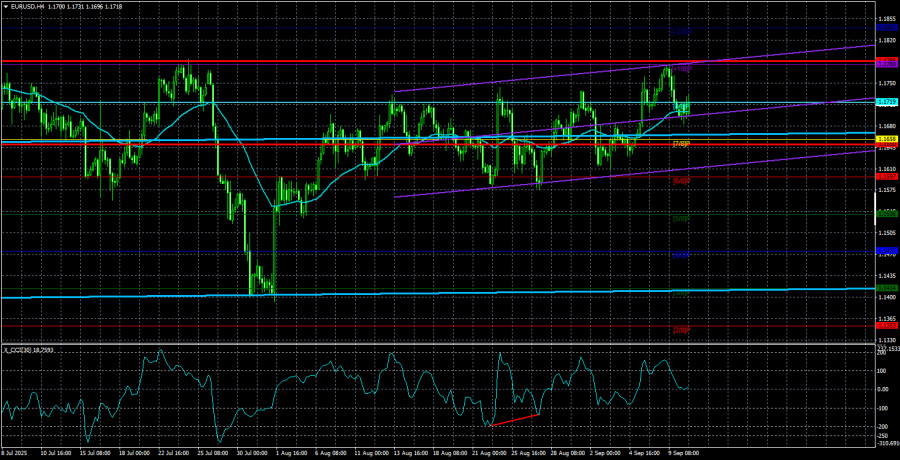
The average volatility for EUR/USD over the last five trading days as of September 11 is 68 pips, which is considered "average." We expect the pair to trade between 1.1650 and 1.1786 on Thursday. The linear regression channel's upper band is pointed upward, which still indicates an uptrend. The CCI indicator has dropped into the oversold area three times, signaling a resumption of the upward trend. There was also a bullish divergence, indicating possible growth.

Nearest Support Levels:

S1 – 1.1719

S2 – 1.1658

S3 – 1.1597

Nearest Resistance Levels:

R1 – 1.1780

R2 – 1.1841

Trading Recommendations:

The EUR/USD pair may resume its upward trend. The US dollar continues to be heavily influenced by Trump's policies, and he shows no signs of stopping. The dollar has rallied as much as possible, but now it seems a new wave of extended decline may be starting. If the price is below the moving average, consider small shorts targeting 1.1597. As long as the price stays above the moving average, long positions remain relevant with targets at 1.1780 and 1.1841 in continuation of the trend.

Chart Elements Explained:

  • Linear regression channels help determine the current trend. If both channels point in the same direction, the trend is strong.
  • The moving average line (settings 20,0, smoothed) indicates the short-term trend and trade direction.
  • Murray levels serve as target levels for moves and corrections.
  • Volatility levels (red lines) are the likely price channel for the next day, based on current volatility readings.
  • The CCI indicator: dips below -250 (oversold) or rises above +250 (overbought) mean a trend reversal may be near.
Paolo Greco,
انسٹافاریکس کا تجزیاتی ماہر
© 2007-2025
Summary
Urgency
Analytic
Stanislav Polyanskiy
Start trade
انسٹافاریکس کے ساتھ کرپٹو کرنسی کی معاملاتی تبدیلیوں سے کمائیں۔
میٹا ٹریڈر 4 ڈاؤن لوڈ کریں اور اپنی پہلی ٹریڈ کھولیں۔
  • Grand Choice
    Contest by
    InstaForex
    InstaForex always strives to help you
    fulfill your biggest dreams.
    مقابلہ میں شامل ہوں
  • چانسی ڈیپازٹ
    اپنے اکاؤنٹ میں 3000 ڈالر جمع کروائیں اور حاصل کریں$3000 مزید!
    ہم ستمبر قرعہ اندازی کرتے ہیں $3000چانسی ڈیپازٹ نامی مقابلہ کے تحت
    اپنے اکاؤنٹ میں 3000 ڈالر جمع کروانے پر موقع حاصل کریں - اس شرط پر پورا اُترتے ہوئے اس مقابلہ میں شرکت کریں
    مقابلہ میں شامل ہوں
  • ٹریڈ وائز، ون ڈیوائس
    کم از کم 500 ڈالر کے ساتھ اپنے اکاؤنٹ کو ٹاپ اپ کریں، مقابلے کے لیے سائن اپ کریں، اور موبائل ڈیوائسز جیتنے کا موقع حاصل کریں۔
    مقابلہ میں شامل ہوں
  • 100 فیصد بونس
    اپنے ڈپازٹ پر 100 فیصد بونس حاصل کرنے کا آپ کا منفرد موقع
    بونس حاصل کریں
  • 55 فیصد بونس
    اپنے ہر ڈپازٹ پر 55 فیصد بونس کے لیے درخواست دیں
    بونس حاصل کریں
  • 30 فیصد بونس
    ہر بار جب آپ اپنا اکاؤنٹ ٹاپ اپ کریں تو 30 فیصد بونس حاصل کریں
    بونس حاصل کریں

تجویز کردہ مضامین

ابھی فوری بات نہیں کرسکتے ؟
اپنا سوال پوچھیں بذریعہ چیٹ.
Widget callback