GBP/USD 5-Minute Analysis
The GBP/USD pair also traded in a very strange and frustrating way for traders on both Tuesday and Wednesday. On Tuesday, there was a decline when everyone expected growth. On Wednesday, the British pound edged higher, but volatility was again near zero. The market justifiably ignored the Producer Price Index, since the Consumer Price Index will be released today, and it no longer matters much. If inflation rises rapidly, the Fed will still cut the key rate at least twice this year. What happens next year is anyone's guess. If inflation grows slowly or not at all, the odds of monetary easing at every meeting through the year-end will grow even stronger, which are already high.
Thus, the inflation report can provoke a slight dollar rally if the actual figure comes in below the forecast. The British pound still faces no significant problems and is barely correcting. The lack of upward movement on Tuesday and Wednesday may look strange, but the price cannot move in just one direction forever, even with such seemingly strong macro and fundamental support.
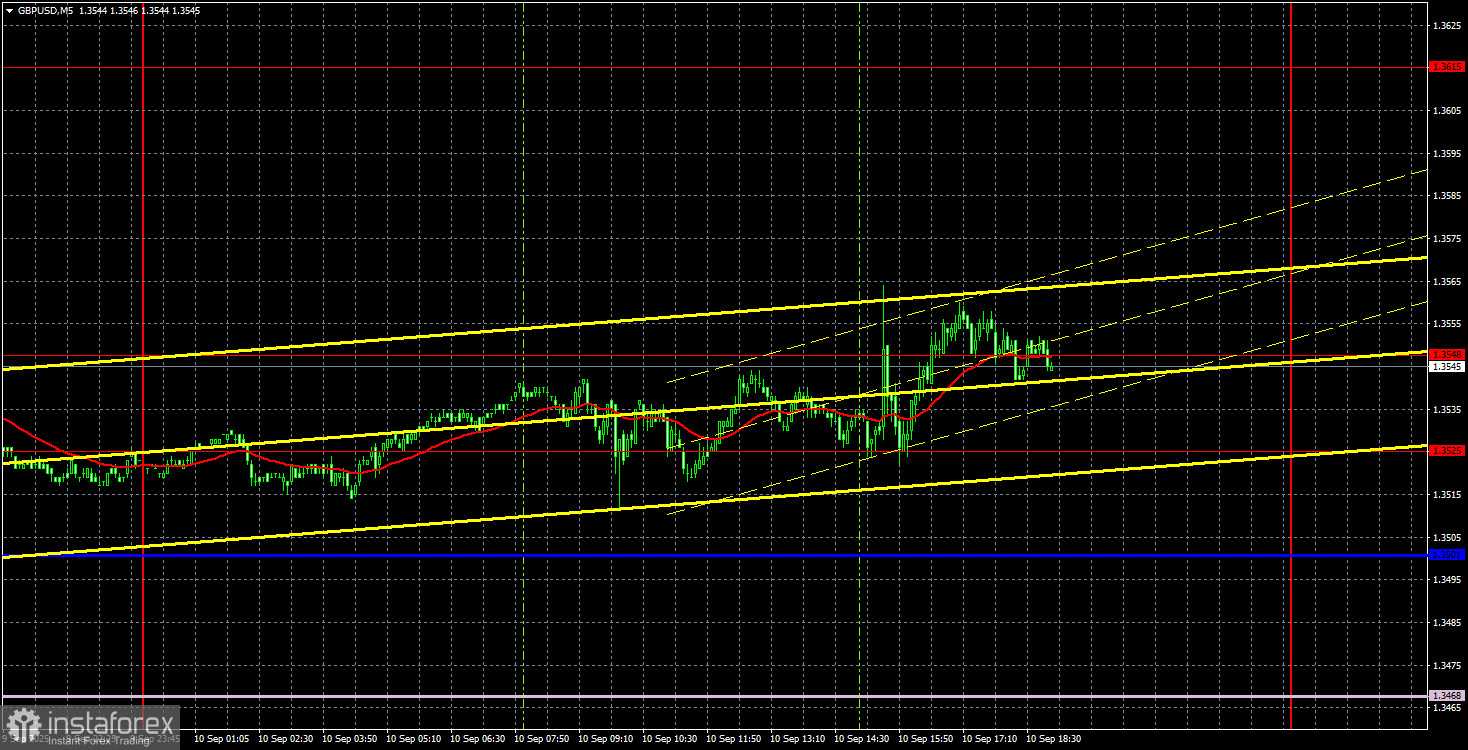
In the 5-minute timeframe, GBP's moves were no better than the euro's. The price ignored levels all day, remaining within the 1.3525–1.3548 area. Volatility was 50 pips. No clear signals were formed—even during the European session.
COT Report
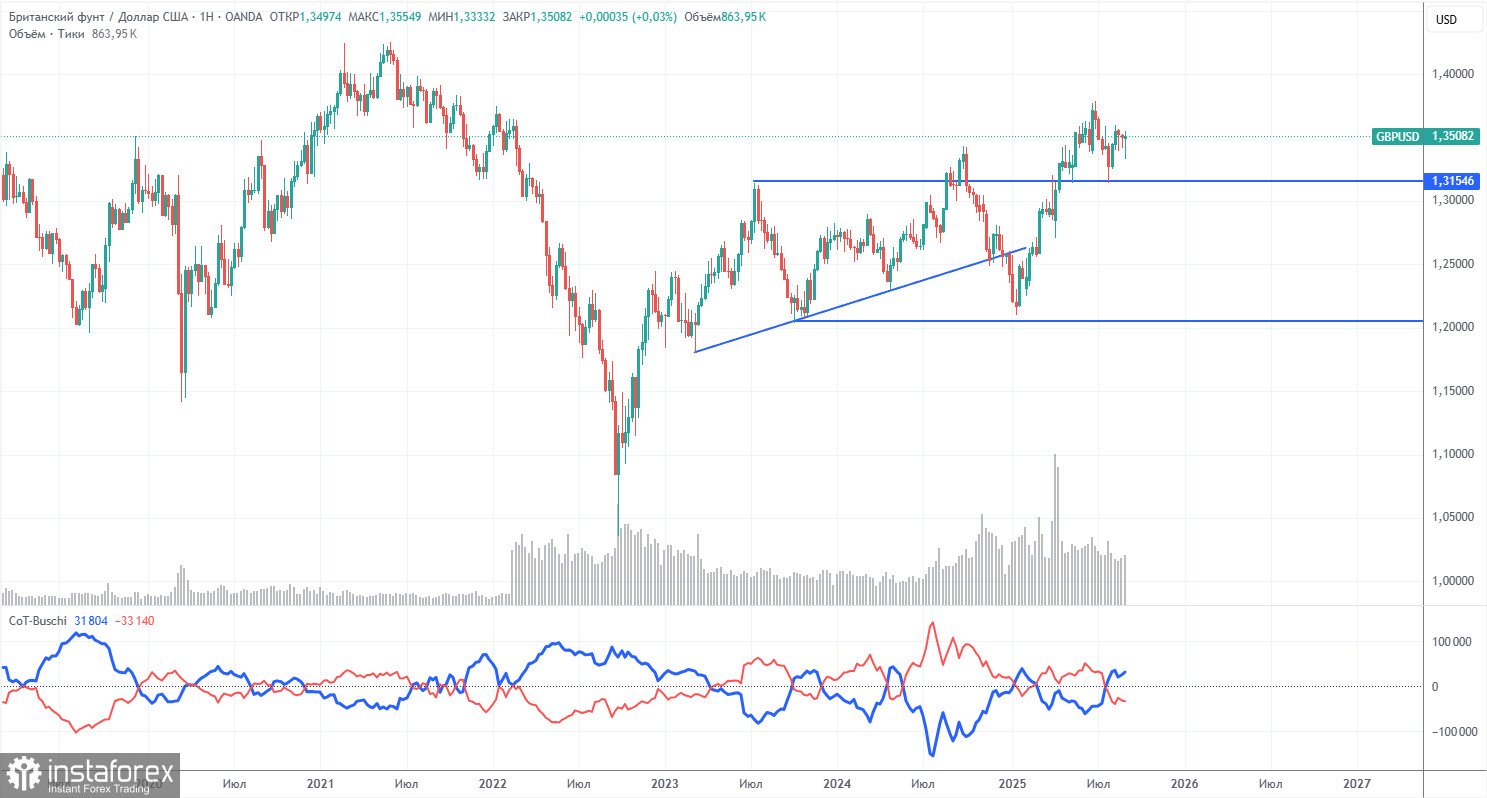
COT reports for the British pound show that in recent years, commercial traders' sentiment has constantly shifted. The red and blue lines—representing commercial and non-commercial net positions—constantly cross and, in most cases, are close to zero. Right now, they are at about the same level, which indicates roughly equal positions for buying and selling.
The dollar continues to decline due to Trump's policies, making demand from market makers for the pound sterling less significant at this time. The trade war will continue in some form for a long while. The Fed will cut rates anyway in the coming year. Dollar demand, one way or another, will fall. According to the latest pound sterling report, the "Non-commercial" group opened 600 BUY contracts and 1,800 SELL contracts. Thus, the net non-commercial position decreased by 1,800 contracts during the week.
GBP surged in 2025, but it's crucial to note that the primary factor was Trump's policy. As soon as that factor is neutralized, the dollar may rise again, but when is anyone's guess. No matter how fast or slow net positioning in the pound grows or falls, it's the dollar that keeps dropping—and usually at a faster rate.
GBP/USD 1-Hour Analysis
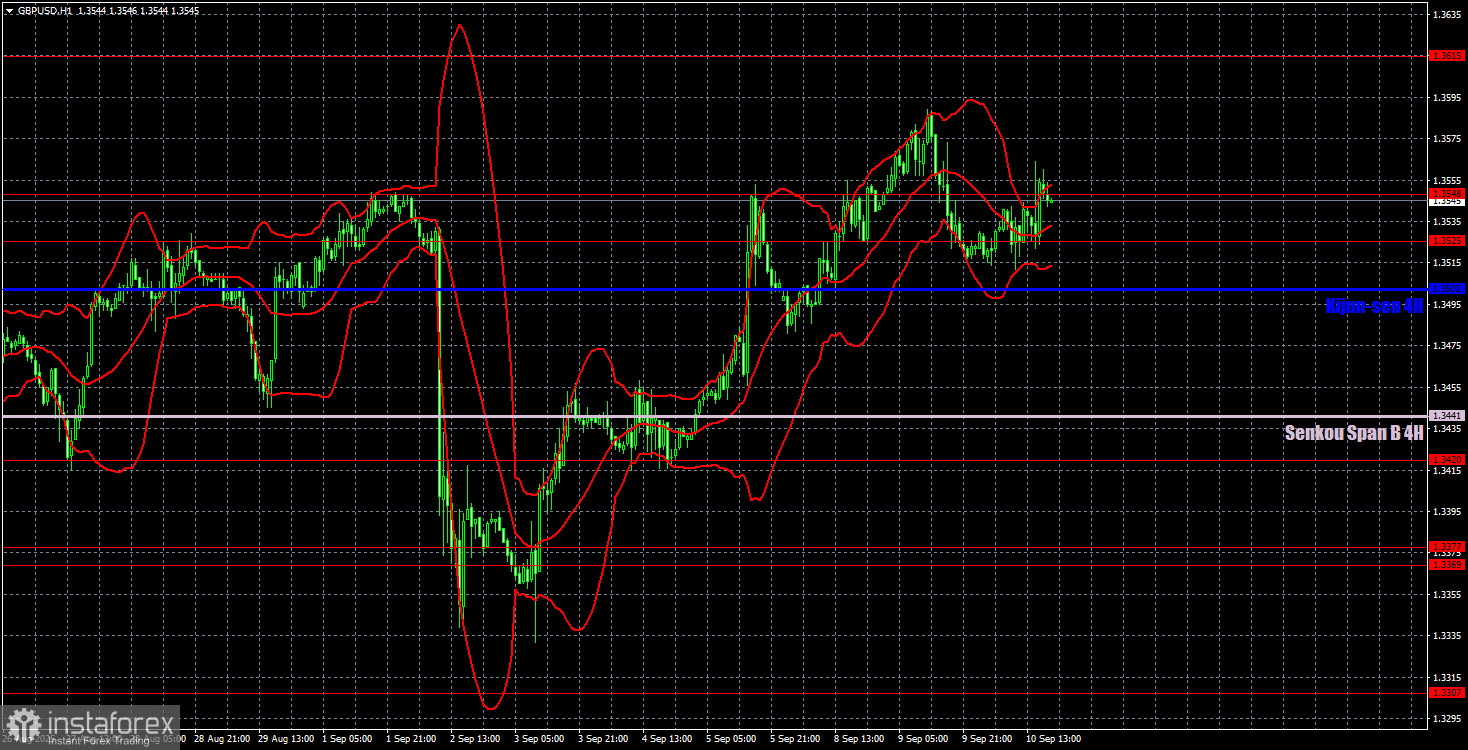
In the hourly timeframe, GBP/USD is ready to form a new upward trend. The fundamental and macro background hasn't changed in recent weeks, so there's still no reason to expect a medium-term dollar rally. There's no trendline right now, though an upward tendency is clear. The market isn't rushing to buy GBP/USD, but realistically, it doesn't have much of a choice.
For September 11, we highlight these important levels: 1.3125, 1.3212, 1.3369–1.3377, 1.3420, 1.3525–1.3548, 1.3615, 1.3681, 1.3763, 1.3833, 1.3886. Senkou Span B (1.3441) and Kijun-sen (1.3502) lines can also provide signals. Set your Stop Loss to breakeven if the price moves 20 pips in your favor. The Ichimoku indicator lines may shift during the day, so consider that when determining signals.
No significant UK news is planned for Thursday, but the US will release an important (in headline terms) inflation report. This report can provoke a market reaction if the result is highly unexpected, but it won't affect the Fed policy decision at the September meeting.
Trading Recommendations
We believe that a new round of growth may begin on Thursday, but much depends on the character of the US inflation report in the afternoon. A dollar rally (pair decline) cannot be completely ruled out. Clear, precise signals are necessary for market entry after the choppy, flat market seen on Wednesday.
Illustration Explanations:
- Support and resistance price levels – thick red lines where movement may end. They are not trading signal sources.
- Kijun-sen and Senkou Span B lines—These are strong Ichimoku indicator lines transferred to the hourly timeframe from the 4-hour one.
- Extremum levels – thin red lines where the price has previously rebounded. These act as trading signal sources.
- Yellow lines – trend lines, trend channels, and other technical patterns.
- Indicator 1 on the COT charts – the size of the net position for each category of traders.