empty
23.04.2025 06:20 PM
EUR/USD: Trading Plan for the US Session on April 23rd (Review of Morning Trades)

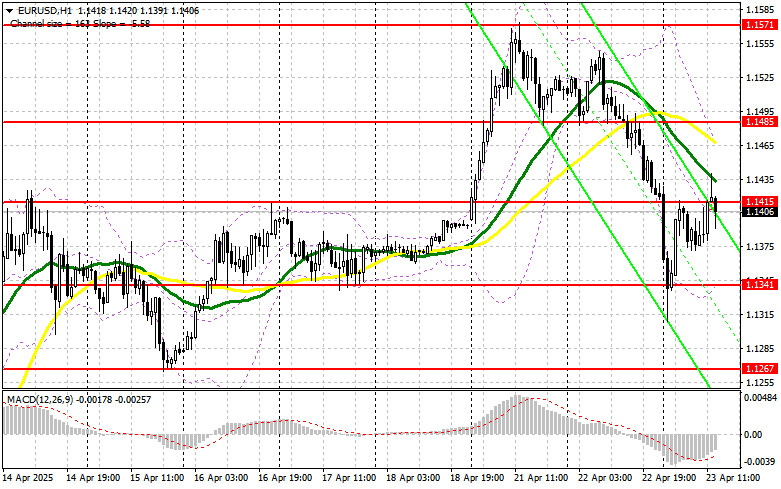
In my morning forecast, I highlighted the 1.1412 level and planned to make trading decisions from there. Let's take a look at the 5-minute chart and analyze what happened. The rise and formation of a false breakout near 1.1412 provided a good entry point for selling the euro; however, the pair failed to see a significant decline. The technical outlook for the second half of the day has not changed substantially.

This image is no longer relevant

To Open Long Positions on EUR/USD:

Weak PMI data from Eurozone countries had little impact on the euro, which has recently been rising due to the US trade war with much of the world. In the second half of the day, similar data will be released for the US. Only strong US Manufacturing and Services PMI data could put pressure back on the euro and support the dollar. Otherwise, the market is likely to continue trading within a sideways channel, favoring further EUR/USD gains.

I plan to act as low as possible. If the pair declines, only a false breakout around the 1.1341 support level will be a reason to buy EUR/USD in anticipation of a continued bullish market, with a potential move toward 1.1415, where the pair is currently trading. A breakout and retest of this range from above will confirm a valid buy entry with a further target of 1.1485. The ultimate target will be 1.1571, where I plan to take profit.

If EUR/USD declines and shows no activity near 1.1341 in the second half of the day, pressure on the pair will increase significantly, potentially leading to a larger correction. In that case, bears could push the price down to 1.1267. Only after a false breakout forms at that level will I consider buying the euro. Alternatively, I will open long positions on a rebound from 1.1206, aiming for a 30–35 point intraday correction.

To Open Short Positions on EUR/USD:

If the euro rises again following US data, bears will need to assert themselves around 1.1415. Only a false breakout at this level will serve as a signal to enter short positions, targeting the 1.1341 support. A breakout and consolidation below this range would be a good setup for selling, aiming for 1.1267—a fairly substantial correction. The ultimate target will be 1.1206, where I plan to take profit. A test of this level would signal a breakdown of the bullish trend.

If EUR/USD rises in the second half of the day and bears fail to show strength around 1.1415—where the moving averages are also located and favor sellers—buyers may push the pair to a new high at 1.1485. I will only consider selling there after an unsuccessful consolidation. I plan to open short positions on a rebound from 1.1571, aiming for a 30–35 point downward correction.

This image is no longer relevant

COT Report (Commitment of Traders) – April 15:

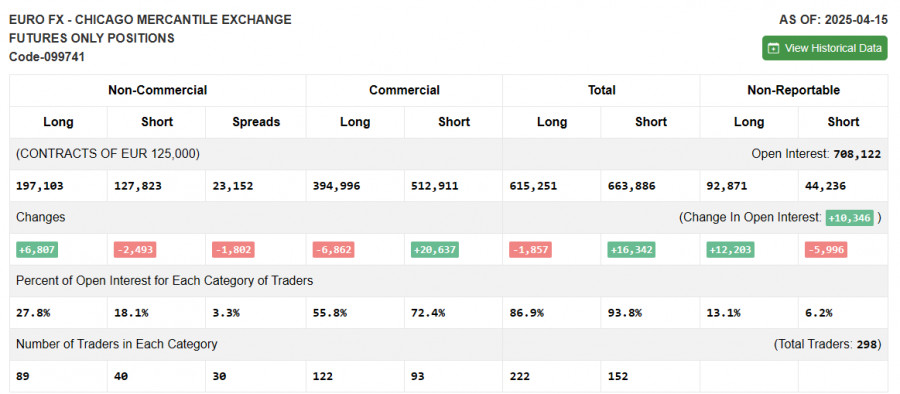
The COT report showed an increase in long positions and a decrease in short ones. Given the lack of a trade deal between the European Union and the US, the euro continues to strengthen while the dollar weakens. Possible market turmoil due to Trump's attempt to remove Jerome Powell as Fed Chair is also putting pressure on the dollar. The report indicates that long non-commercial positions rose by 6,807 to 197,103, while short non-commercial positions fell by 2,493 to 127,823. As a result, the gap between long and short positions narrowed by 2,493.

This image is no longer relevant

Indicator Signals:

Moving Averages Trading is occurring below the 30- and 50-day moving averages, indicating a possible decline in the pair.

Note: The periods and prices of the moving averages are considered by the author on the H1 chart and may differ from the classic daily moving averages on the D1 chart.

Bollinger Bands In the event of a decline, the lower boundary of the indicator around 1.1341 will act as support.

Indicator Descriptions:

  • Moving Average – Smooths out volatility and noise to define the current trend. Period – 50 (yellow on chart) and 30 (green on chart).
  • MACD (Moving Average Convergence/Divergence) – Fast EMA: period 12, Slow EMA: period 26, SMA: period 9.
  • Bollinger Bands – Period 20.
  • Non-commercial traders – Speculators such as individual traders, hedge funds, and large institutions using the futures market for speculative purposes and meeting specific criteria.
  • Long non-commercial positions – Total long open positions held by non-commercial traders.
  • Short non-commercial positions – Total short open positions held by non-commercial traders.
  • Net non-commercial position – The difference between short and long positions held by non-commercial traders.
Miroslaw Bawulski,
انسٹافاریکس کا تجزیاتی ماہر
© 2007-2025
Summary
Urgency
Analytic
Maxim Magdalinin
Start trade
انسٹافاریکس کے ساتھ کرپٹو کرنسی کی معاملاتی تبدیلیوں سے کمائیں۔
میٹا ٹریڈر 4 ڈاؤن لوڈ کریں اور اپنی پہلی ٹریڈ کھولیں۔
  • Grand Choice
    Contest by
    InstaForex
    InstaForex always strives to help you
    fulfill your biggest dreams.
    مقابلہ میں شامل ہوں

تجویز کردہ مضامین

4 اگست کو برطانوی پاؤنڈ/امریکی ڈالر کے لیے تجارتی سفارشات اور تجارتی خرابی: برطانوی پاؤنڈ رجحان کو توڑنے سے ایک قدم دور

برطانوی پاؤنڈ/امریکی ڈالر کرنسی کے جوڑے نے بھی جمعہ کو مضبوط اوپر کی حرکت دکھائی لیکن ٹرینڈ لائن، کیجن سین لائن، اور 1.3307 کی سطح کو توڑنے میں ناکام رہا۔

Paolo Greco 14:12 2025-08-04 UTC+2

4 اگست کو یورو/امریکی ڈالر کے لیے تجارتی سفارشات اور تجارتی خرابی: رجحان بدلنا شروع ہو رہا ہے

یورو/امریکی ڈالر کا 5 منٹ کا تجزیہ یورو/امریکی ڈالر کرنسی کے جوڑے نے جمعہ کو مضبوط نمو ظاہر کی اور Kijun-sen لائن کے اوپر ختم ہوئی۔ اس طرح، تکنیکی نقطہ

Paolo Greco 14:07 2025-08-04 UTC+2

یکم اگست کو یورو/امریکی ڈالر کے جوڑے کی تجارت کیسے کی جائے؟ نئے افراد کے لیے آسان تجاویز اور تجارتی تجزیہ

جمعرات کی تجارت کا تجزیہ یورو/امریکی ڈالر کا 1گھنٹے کا چارٹ یورو/امریکی ڈالر کرنسی کا جوڑا جمعرات کو ایک "بریک" کے لیے رک گیا، جس کی کافی توقع تھی۔ جمعرات

Paolo Greco 14:43 2025-08-01 UTC+2

1 اگست کو یورو/امریکی ڈالر کے لیے تجارتی سفارشات اور تجارتی خرابی: طوفان سے پہلے پرسکون

یورو/امریکی ڈالر کا 5 منٹ کا تجزیہ یورو/امریکی ڈالر کرنسی کا جوڑا جمعرات کو موقوف ہوا، جیسا کہ ہم نے توقع کی تھی۔ اس دن کے لیے کوئی بڑی رپورٹس

Paolo Greco 14:20 2025-08-01 UTC+2

31 جولائی کو برطانوی پاؤنڈ/امریکی ڈالر پیئر کی تجارت کیسے کی جائے؟ نئے افراد کے لیے آسان تجاویز اور تجارتی تجزیہ

بدھ کی تجارت کا تجزیہ برطانوی پاؤنڈ/امریکی ڈالر کا 1گھنٹے کا چارٹ بدھ کے روز، برطانوی پاؤنڈ/امریکی ڈالر کے جوڑے نے بھی یورو/امریکی ڈالر جیسی وجوہات کی بناء

Paolo Greco 14:16 2025-07-31 UTC+2

How to Trade the EUR/USD Pair on July 31? Simple Tips and Trade Analysis for Beginners

Analysis of Wednesday's Trades 1H Chart of EUR/USD On Wednesday, the EUR/USD currency pair continued to decline almost the entire day. This time, the U.S. dollar received strong support from

Paolo Greco 14:15 2025-07-31 UTC+2

Trading Recommendations and Trade Breakdown for EUR/USD on July 31: Hour by Hour, It Gets Tougher

On Wednesday, the EUR/USD currency pair continued its downward movement. The decline in the euro and the rise in the dollar were essentially triggered by just one report, despite

Paolo Greco 13:39 2025-07-31 UTC+2

30 جولائی کو برطانوی پاؤنڈ/امریکی ڈالر کے پیئر کی تجارت کیسے کی جائے؟ نئے افراد کے لیے آسان تجاویز اور تجارتی تجزیہ

منگل کی تجارت کا تجزیہ برطانوی پاؤنڈ/امریکی ڈالر کا 1گھنٹے کا چارٹ منگل کو،برطانوی پاؤنڈ/امریکی ڈالر جوڑے نے بھی اپنی نیچے کی طرف حرکت جاری رکھی، حالانکہ یہ کافی تیزی

Paolo Greco 13:56 2025-07-30 UTC+2

30 جولائی کو یورو/امریکی ڈالر کے جوڑے کی تجارت کیسے کی جائے؟ نئے افراد کے لیے آسان تجاویز اور تجارتی تجزیہ

منگل کی تجارت کا تجزیہ یورو/امریکی ڈالر کا 1گھنٹے کا چارٹ منگل کو، یورو/امریکی ڈالر کرنسی کے جوڑے نے اپنی گراوٹ کو جاری رکھا، حالانکہ پیر کی رفتار سے نہیں۔

Paolo Greco 13:55 2025-07-30 UTC+2

30 جولائی کو برطانوی پاؤنڈ/مریکی ڈالر کے لیے تجارتی سفارشات اور تجارتی خرابی: پاؤنڈ عارضی طور پر اپنا فائدہ کھو دیتا ہے

برطانوی پاؤنڈ/مریکی ڈالر کا 5 منٹ کا تجزیہ برطانوی پاؤنڈ/مریکی ڈالر کرنسی کے جوڑے نے منگل کو بھی نیچے کی طرف حرکت جاری رکھی، حالانکہ پیر یا پچھلے ہفتے

Paolo Greco 13:52 2025-07-30 UTC+2
ابھی فوری بات نہیں کرسکتے ؟
اپنا سوال پوچھیں بذریعہ چیٹ.
Widget callback
 

Dear visitor,

Your IP address shows that you are currently located in the USA. If you are a resident of the United States, you are prohibited from using the services of InstaFintech Group including online trading, online transfers, deposit/withdrawal of funds, etc.

If you think you are seeing this message by mistake and your location is not the US, kindly proceed to the website. Otherwise, you must leave the website in order to comply with government restrictions.

Why does your IP address show your location as the USA?

  • - you are using a VPN provided by a hosting company based in the United States;
  • - your IP does not have proper WHOIS records;
  • - an error occurred in the WHOIS geolocation database.

Please confirm whether you are a US resident or not by clicking the relevant button below. If you choose the wrong option, being a US resident, you will not be able to open an account with InstaForex anyway.

We are sorry for any inconvenience caused by this message.