The EUR/USD currency pair traded on Friday with very low volatility once again. Over the past few months, the average volatility has dropped to 53-60 pips per day, down from 75-90 pips during the summer. However, the decline in volatility should come as no surprise, as a flat trend has persisted on the daily timeframe for several months. Typically, a flat trend is characterized by low volatility and illogical movements within a sideways range, which is precisely what we are observing now. In the short term, nearly every movement of the pair since at least October cannot be explained logically. However, in the medium term, we see a flat trend, and explanations for such movements are unnecessary.
On Friday, one notable event was the University of Michigan consumer sentiment index, which declined once again from 53.6 to 50.3. Consequently, the drop in the U.S. dollar was somewhat justified. However, overall, the dollar has been rising for almost a month and a half without any real reason. Of course, any event or report can be twisted in any direction convenient for experts or analysts. For instance, many still argue that the Federal Reserve showed "insufficient dovishness" at the last meeting, which triggered the dollar's rise. We do not share this view. The flat trend remains the main factor dictating all movements.
When the flat trend eventually concludes, we can then discuss a new trend and associated characteristics. On the daily timeframe, it is clear that the price approached the lower boundary of the flat at 1.1400 last week. The price did not thoroughly test this level, but a flat trend is always random, not a precise movement from one channel line to another. Therefore, we can speculate that the downward movement within the flat has concluded. In this case, we could expect the pair to rise to 1.1800, which does not require any fundamental or macroeconomic basis.
Since this involves the euro's growth and the dollar's decline, there is no need to search for reasons for upward movement. The U.S. is still experiencing a shutdown; the labor market is "in disarray but promising to return"; Donald Trump's protectionist policies continue to deter investors and immigrants; labor migrants are being expelled from the U.S.; the Fed is taking a dovish stance; and the trade war is ongoing. Thus, we believe that the dollar's decline will continue based on at least the global fundamental events occurring worldwide. The dollar is no longer an unyielding and steadfast store of value. Confidence in it is declining even among central banks. Only after a confident break below 1.1400 will we consider alternative scenarios for the currency market. However, it remains very difficult to imagine what could lead to further dollar growth.
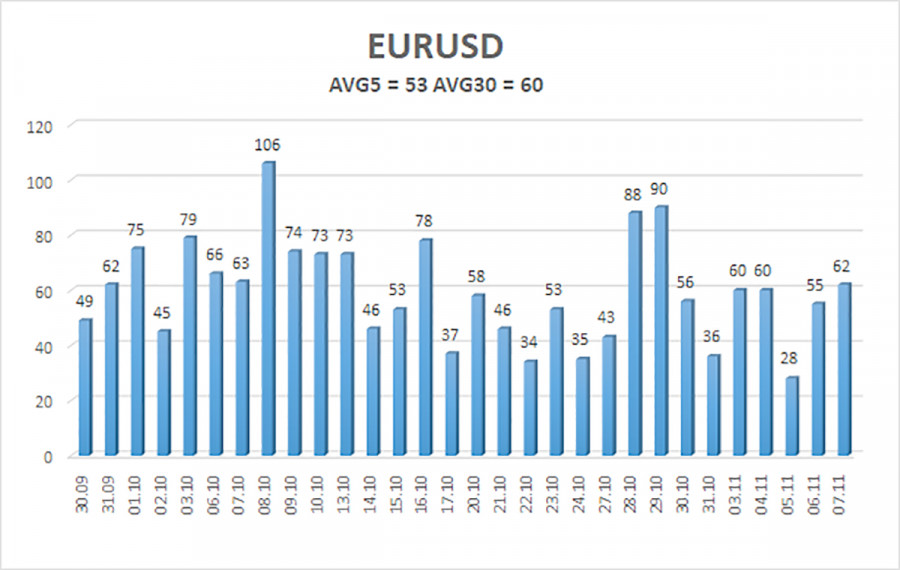
The average volatility of the EUR/USD currency pair over the last five trading days as of November 10 is 53 pips, characterized as "low." We expect the pair to trade between 1.1511 and 1.1617 on Monday. The upper channel of the linear regression is downward, signaling a downward trend, but in reality, a flat trend persists on the daily timeframe. The CCI indicator entered the oversold area twice in October, which could signal a new wave of the upward trend in 2025.
Nearest Support Levels:
- S1 – 1.1536
- S2 – 1.1475
- S3 – 1.1414
Nearest Resistance Levels:
- R1 – 1.1597
- R2 – 1.1658
- R3 – 1.1719
Trading Recommendations:
The EUR/USD pair has once again settled above the moving average, with an upward trend continuing across all higher timeframes, while a flat trend has persisted on the daily timeframe for several months. The global fundamental background continues to exert a strong influence on the U.S. dollar. Recently, the dollar has shown growth, but the reasons for this movement may be purely technical. If the price is positioned below the moving average, small short positions can be considered with targets at 1.1475 and 1.1414 based solely on technical factors. Above the moving average line, long positions remain relevant, aiming for 1.1800 (the upper line of the flat trend on the daily timeframe).
Explanations for Illustrations:
- Linear regression channels help determine the current trend. If both are directed in the same way, it indicates that the trend is currently strong.
- The moving average line (settings 20,0, smoothed) defines the short-term trend and the direction in which trading should currently be conducted.
- Murray levels are target levels for movements and corrections.
- Volatility levels (red lines) represent the likely price channel in which the pair will spend the following days, based on current volatility indicators.
- The CCI indicator entering the oversold territory (below -250) or overbought territory (above +250) indicates that a trend reversal in the opposite direction is approaching.


