The GBP/USD currency pair traded lower again on Friday, though this time there were grounds to buy the British pound. In the morning, three more or less significant reports were released in the UK: business activity indices in the services and manufacturing sectors, as well as retail sales. All three reports were more positive than analysts' forecasts. Thus, there were reasons for the British currency to rise from the very beginning of the day.
In the afternoon, the U.S. published an inflation report, which can confidently be considered the main event of the week. The Consumer Price Index (CPI) in the U.S. was released with a 10-day delay and showed weaker-than-expected inflation growth, of only 3%. Core inflation even decreased to 3% year-on-year. As a result, this report opens the possibility of the Fed cutting the key interest rate several times.
Let's recall that market confidence in two rate cuts by the end of the year has remained high recently. However, the inflation report underscored the need for the central bank's decision. As a result, the dollar might naturally decline after this report, but it did not.
Also, in the afternoon, business activity indices in the U.S. were released, along with the University of Michigan consumer sentiment index. The business activity indices exceeded analysts' forecasts, prompting a buying of the dollar, but the consumer sentiment index also showed another decline. Thus, two not-so-important reports (more significant business activity indices, such as ISM, are published in the U.S.) supported the dollar, while five much more important reports indicated its decline. Yet by the end of the day, the dollar still rose.
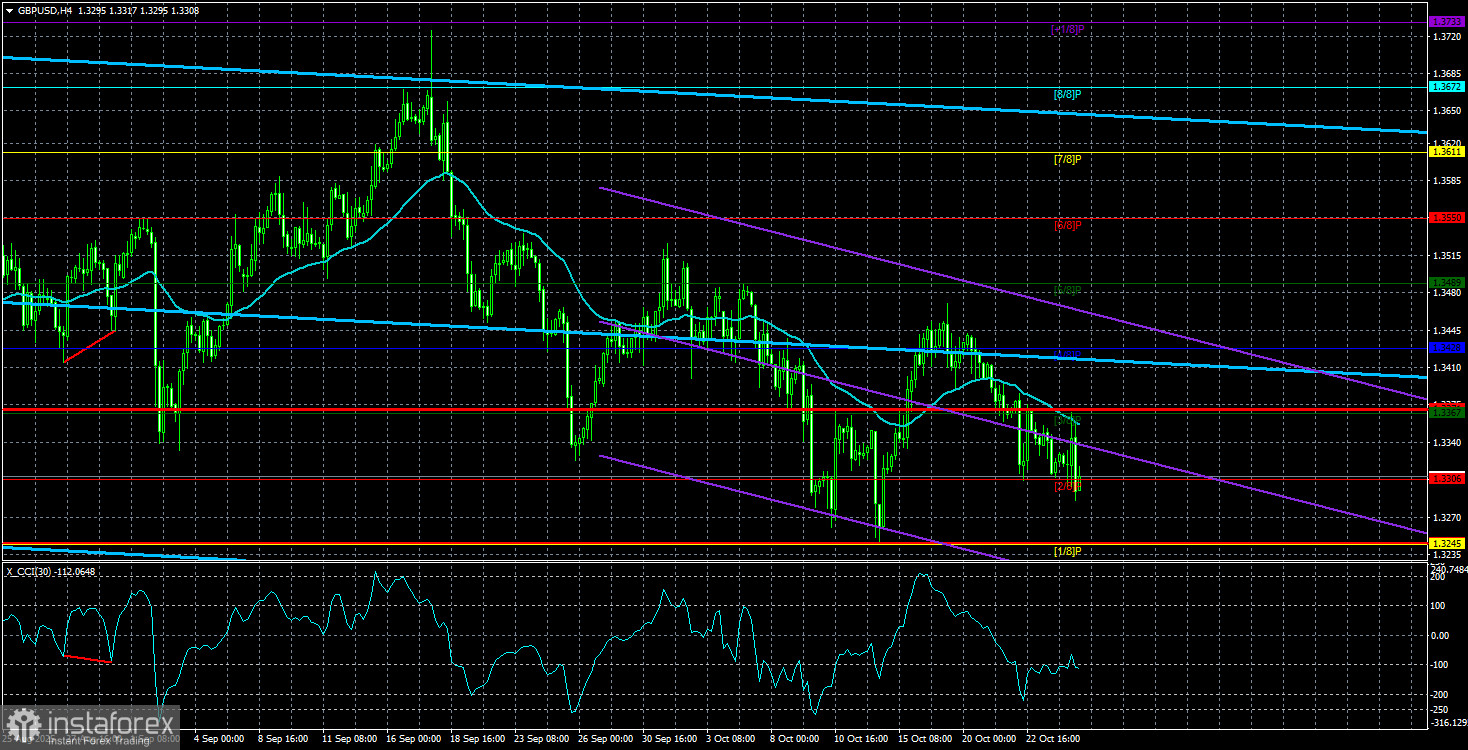
As mentioned, there is almost no logic in the market movements right now. The sideways trend on the daily timeframe persists and is considered the primary source of problems for traders. Movements within a sideways trend are always random, which we have observed throughout October.
Next week, the Federal Reserve meeting will take place, and the probability of a rate cut stands at 146%. Therefore, a decline of the dollar could be expected. However, the market has been confident in this decision for a whole month, during which the dollar has steadily risen. Hence, it is unlikely that this event will be "priced in" in advance. When the market begins to respond to incoming information logically is uncertain. The FOMC meeting may serve as a starting point for a new upward trend in EUR/USD and GBP/USD. But it may also not happen. I believe it is most logical to wait for a resumption of the upward trend by 2025 in the range of 1.3100-1.3250, where the last two local minima are located, around which the downward movement within the sideways trend may conclude.
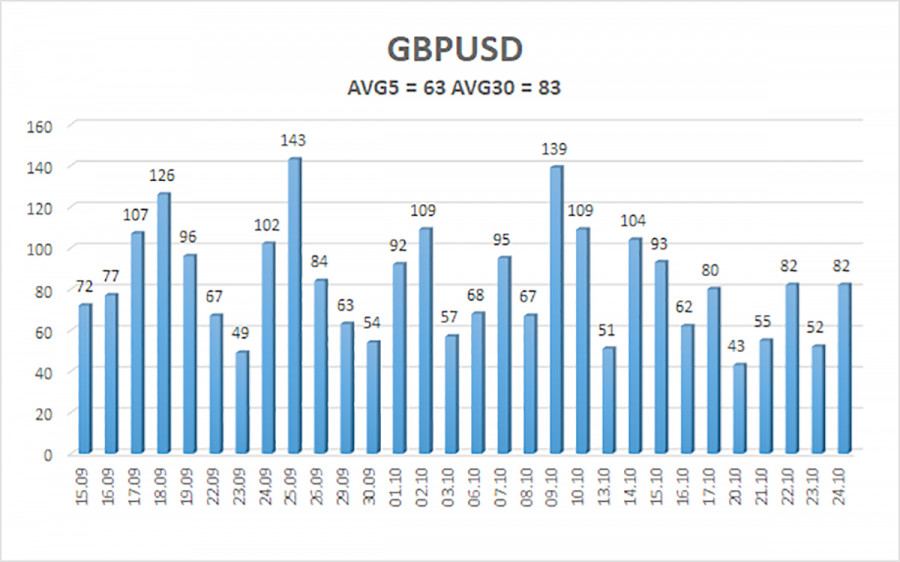
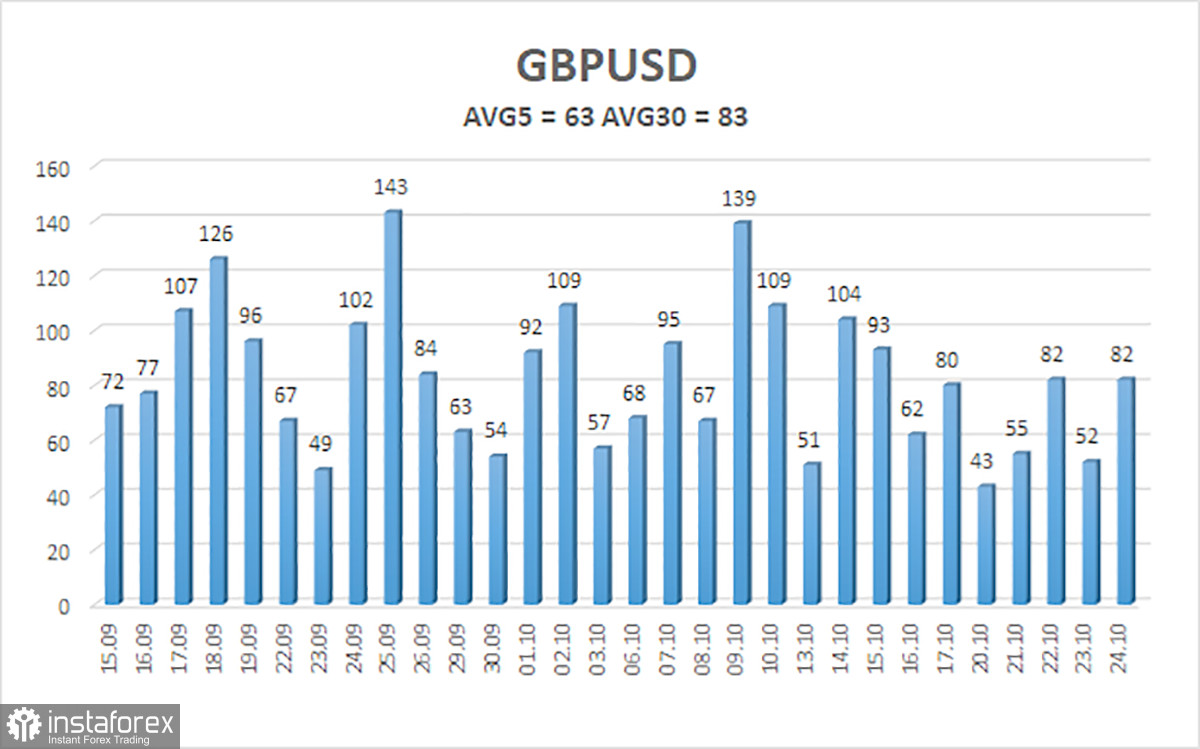
The average volatility for the GBP/USD pair over the last five trading days, as of October 27, is 63 pips. For the pound/dollar pair, this is considered "average." On Monday, we therefore expect movement within the range limited by levels 1.3245 and 1.3371. The upper channel of the linear regression is pointing upwards, indicating a prevailing upward trend. The CCI indicator has entered the oversold territory three times, which might signal a resumption of the upward trend.
Nearest Support Levels:
- S1 – 1.3306
- S2 – 1.3245
- S3 – 1.3184
Nearest Resistance Levels:
- R1 – 1.3367
- R2 – 1.3428
- R3 – 1.3489
Trading Recommendations:
The GBP/USD pair is attempting to resume the 2025 upward trend, and its long-term prospects remain unchanged. Donald Trump's policies will continue to exert pressure on the dollar, so we do not expect the U.S. currency to grow. Thus, long positions targeting 1.3672 and 1.3733 remain much more relevant while the price is above the moving average. If the price is below the moving average line, small shorts can be considered targeting 1.3245 on purely technical grounds. From time to time, the U.S. currency shows corrections, but for a trend to strengthen, it needs real signs of resolution in the trade war or other global positive factors.
Explanations for Illustrations:
- Linear regression channels help determine the current trend. If both are directed in the same way, it indicates a strong trend.
- The moving average line (settings 20,0, smoothed) defines the short-term trend and the direction in which trading should currently be conducted.
- Murray levels are target levels for movements and corrections.
- Volatility levels (red lines) indicate the probable price channel in which the pair will trade over the next day, based on current volatility indicators.
- The CCI indicator: its entry into the oversold area (below -250) or the overbought area (above +250) indicates that a trend reversal in the opposite direction is approaching.