EUR/USD 5-Minute Analysis
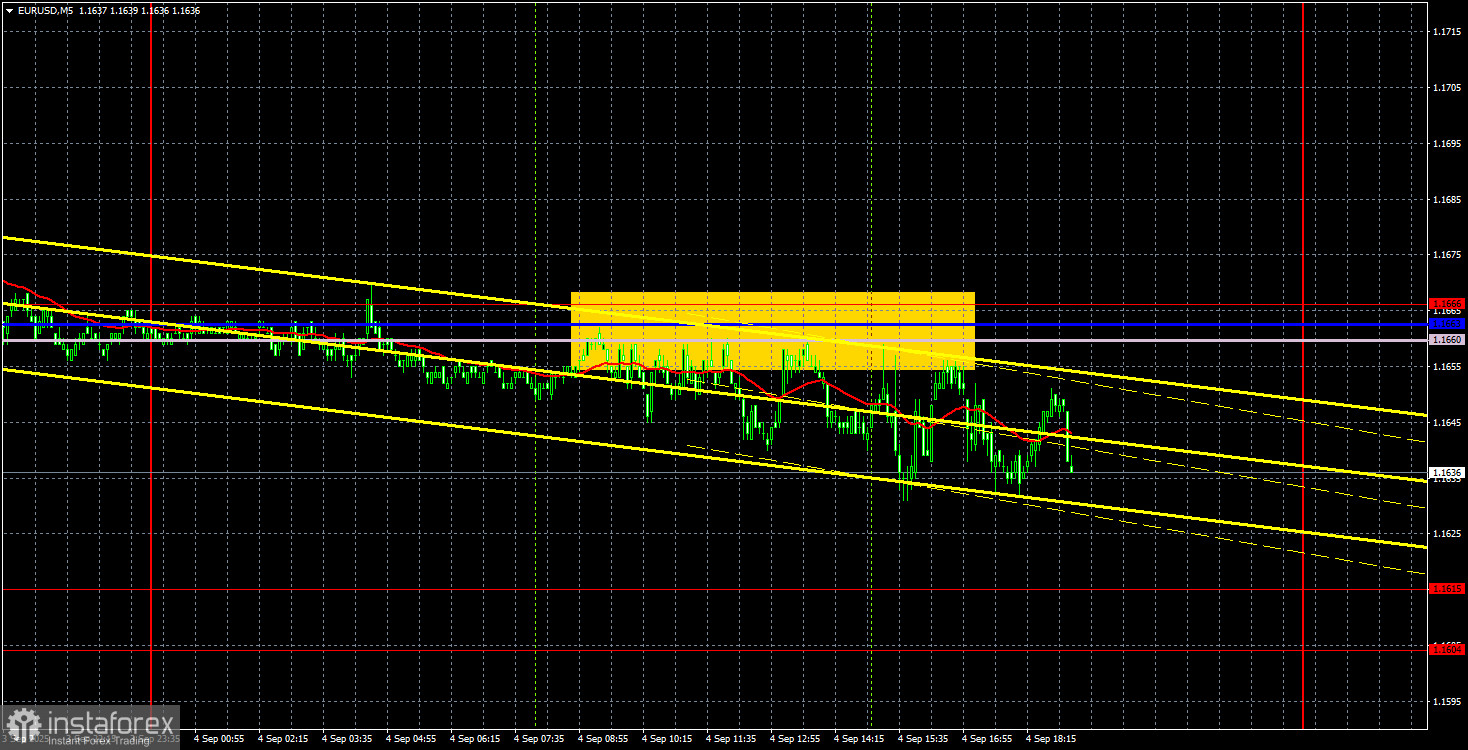
Throughout Thursday, the EUR/USD currency pair was essentially in convulsions all day. Despite the publication of lots of important reports this week, the market is simply refusing to trade and refusing to break out of its flat range. Yesterday was the apotheosis of absurdity. The ISM Services PMI from the US became the first US report this week that showed a decent result, but the market practically ignored this indicator. Volatility for most of the day was tiny.
Thus, the flat persists, and now it's far from certain whether today's labor market and unemployment reports will have any impact on trader sentiment. More precisely, they are likely to have some influence, but will it be enough to end the three-week flat in EUR/USD? We're now very doubtful about that. Is there any point in trading in the current conditions? That's also an open question. Traders should note that market moves are currently very weak, with no discernible trend. Therefore, even strong signals mostly do not work out.
On the 5-minute timeframe, you can see the pair's movement on Thursday even more clearly. As mentioned, it's convulsing. During the day, the price bounced some 10 times from the 1.1660–1.1666 area, but only managed to fall 20–25 pips lower each time.
COT Report
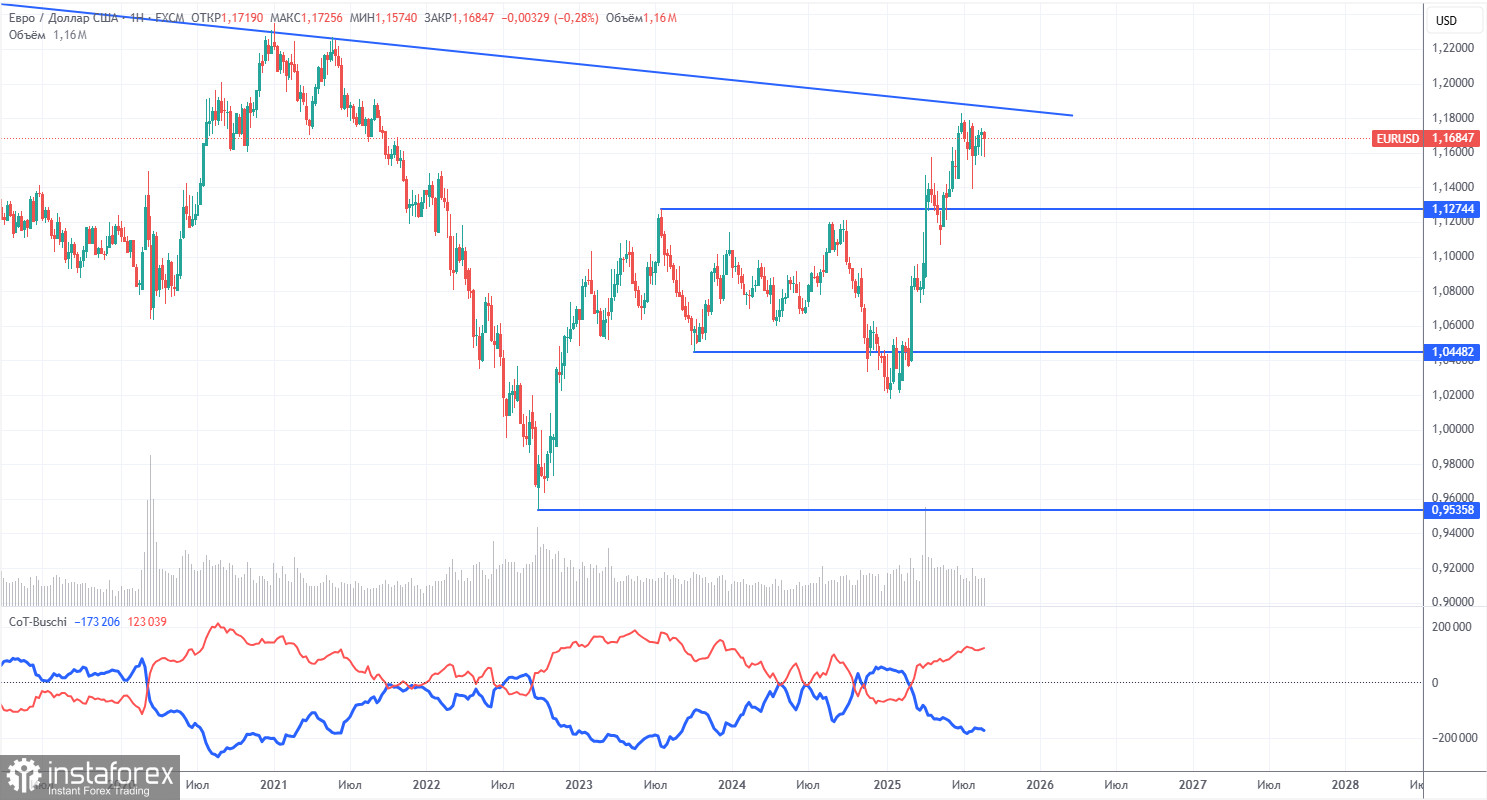
The latest COT report is dated August 26. As shown in the chart above, the net position of non-commercial traders remained bullish for a prolonged period; bears briefly gained the upper hand at the end of 2024 but quickly lost it. Since Trump became the US President, the dollar has been the only currency to decline. We can't say with 100% certainty that the US dollar will continue to fall, but current global developments seem to suggest this scenario.
We still see no fundamental factors that would strengthen the euro, while there remain plenty of factors that could lead to further dollar weakness. The global downtrend remains in place, but what does it matter that the price has moved for the last 17 years? As soon as Trump ends his trade wars, the dollar might recover, but recent events show that the war is likely to continue in one form or another. The possible loss of Fed independence is another major pressure factor for the US currency.
The positioning of the red and blue lines on the indicator continues to point to a bullish trend. In the last reporting week, long positions held by the "Non-commercial" group grew by 5,700, while short positions grew by 1,300. Accordingly, the net position increased by 4,400 contracts during the week.
EUR/USD 1-Hour Analysis
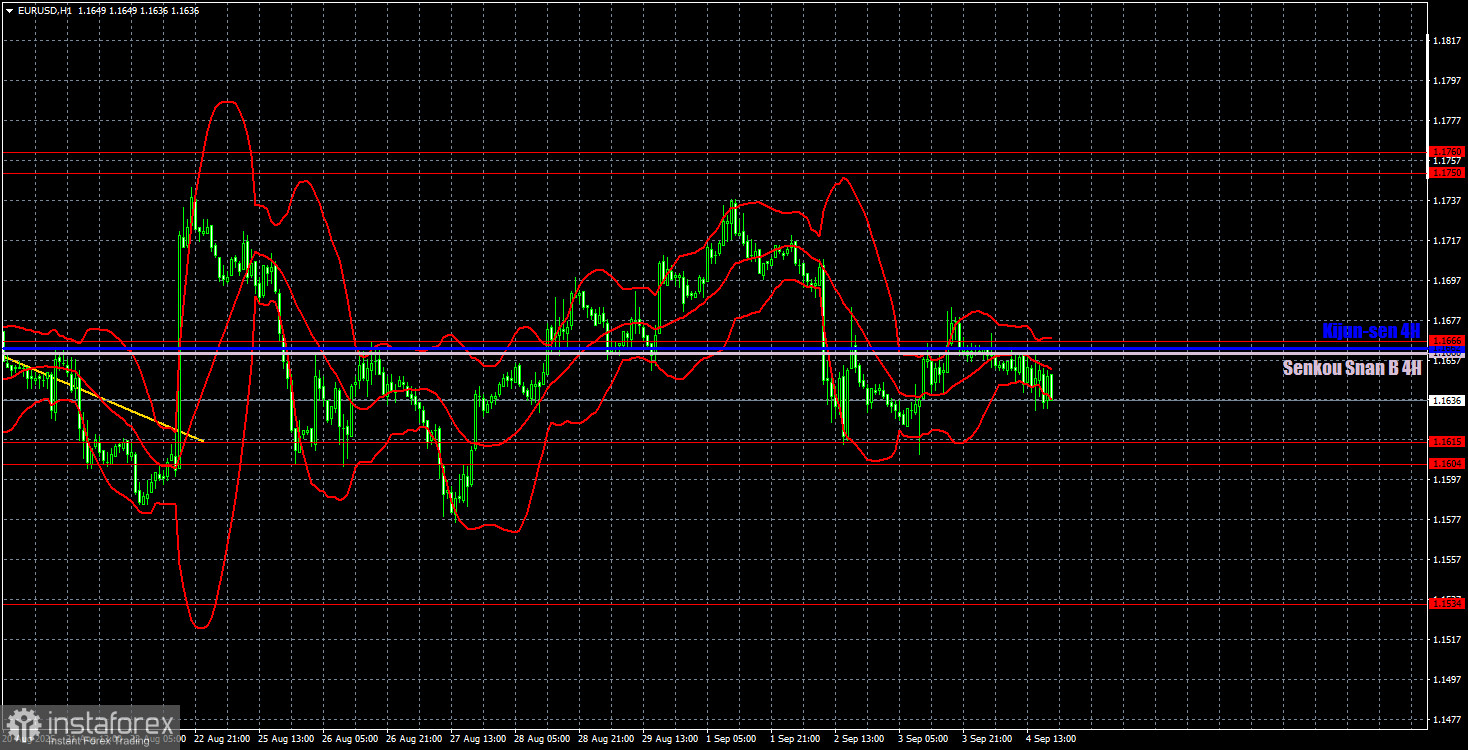
On the hourly chart, the EUR/USD pair made the first step toward forming a new uptrend, but for the past several weeks, the market has been flat. Those global factors depressing the dollar, about which we constantly talk, haven't gone anywhere. We still see no basis for a medium-term dollar rebound, so we cannot forecast its growth.
For September 5, we highlight the following levels for trading: 1.1092, 1.1147, 1.1185, 1.1234, 1.1274, 1.1362, 1.1426, 1.1534, 1.1604–1.1615, 1.1666, 1.1750–1.1760, 1.1846–1.1857, as well as the Senkou Span B (1.1660) and Kijun-Sen (1.1663) lines. The Ichimoku indicator lines can move during the day, which should be taken into account when identifying trade signals. Don't forget to set your Stop Loss to breakeven if the price moves 15 pips in your favor—this will safeguard against possible losses if a signal turns out to be false.
On Friday, the EU will release its third estimate for Q2 GDP, which no one really cares about, and in the US, unemployment and Nonfarm Payrolls data will be released—these are the ones that should at least change the character of EUR/USD's movement. Remember, the Fed's decision in two weeks depends on the labor market and unemployment reports.
Trading Recommendations
On Friday, the price may continue to move towards the 1.1604–1.1615 area, as it bounced off the 1.1660–1.1666 area yesterday. Growth in the euro can be expected after a rebound from 1.1604–1.1615, or if the price consolidates above 1.1660–1.1666.
Illustration Explanations:
- Support and resistance price levels – thick red lines where movement may end. They are not trading signal sources.
- Kijun-sen and Senkou Span B lines—These are strong Ichimoku indicator lines transferred to the hourly timeframe from the 4-hour one.
- Extremum levels – thin red lines where the price has previously rebounded. These act as trading signal sources.
- Yellow lines – trend lines, trend channels, and other technical patterns.
- Indicator 1 on the COT charts – the size of the net position for each category of traders.