GBP/USD 5M Analysis
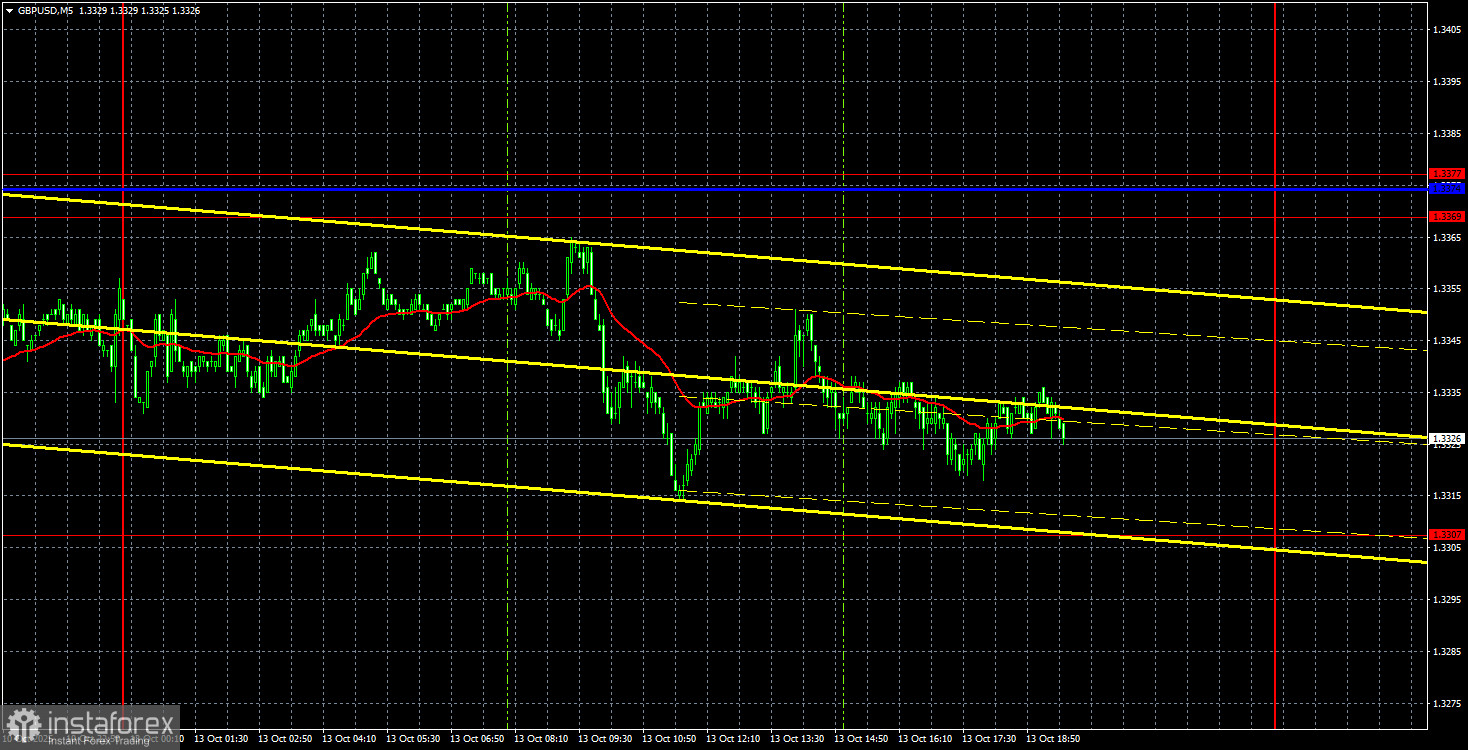
On Monday, the GBP/USD currency pair declined slightly once again, but the moment of truth is approaching. Price action is now very close to the second successive descending trendline, which could be breached as early as this week. The Ichimoku Kijun-sen line is also nearby, so both technical barriers may be overcome simultaneously.
We continue to view the current downturn in the pair as completely illogical and unjustified. Over the past 2–3 weeks, there hasn't been enough negative news for the British pound—or positive data for the dollar—to warrant such sustained pressure on GBP/USD. Many of the reasons behind this move seem fabricated. For instance, the political crisis in France has nothing to do with the pound—and such "crises" in the EU occur every couple of months.
Therefore, we again emphasize to traders that the daily timeframe shows the formation of a broad flat pattern, while the broader 2025 uptrend remains intact. We continue to expect further gains in the British pound. Market participants are actively ignoring events that are fundamentally bearish for the dollar, likely due to large-scale price manipulation by market makers. These big players may be giving the illusion of a downtrend to encourage unwarranted selling.
On the 5-minute chart, not a single trading signal was generated on Monday. Therefore, opening any positions was not advisable. Even on the lowest timeframes, market movement is choppy at best—and lacks any clear logic.
COT Report
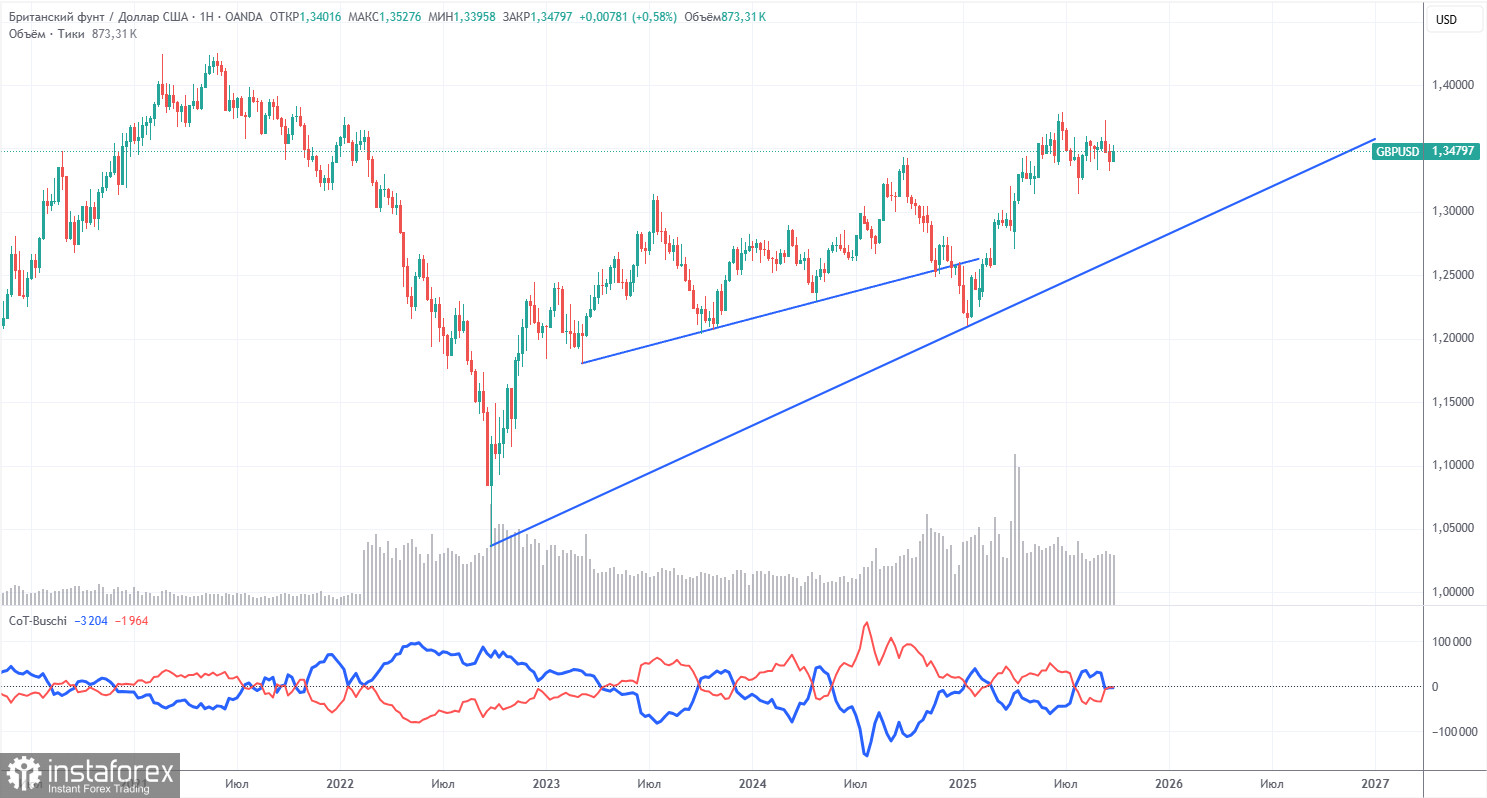
COT (Commitment of Traders) data for the British pound shows that commercial trader sentiment has been shifting frequently over recent years. The red and blue lines—representing net positions of commercial and non-commercial traders—are constantly crossing and generally hover near the zero line.
Currently, both lines are nearly aligned, indicating a relatively equal number of buy and sell positions.
The U.S. dollar continues to weaken, mainly due to Donald Trump's policies. As a result, market maker interest in the pound has become less relevant. The trade war will continue in one form or another for the foreseeable future. The Federal Reserve is expected to cut rates over the next year, meaning downward pressure on the dollar will persist.
According to the latest data, non-commercial traders opened 3,700 new long positions and closed 900 shorts during the reporting week. Thus, the net position grew by 4,600 contracts.
The British pound has rallied significantly in 2025, primarily due to Trump's agenda. If and when this factor fades, the dollar may regain strength—but when that will happen, no one knows.
In any case, net positioning trends suggest more consistent dollar weakness than pound weakness.
GBP/USD 1H Analysis
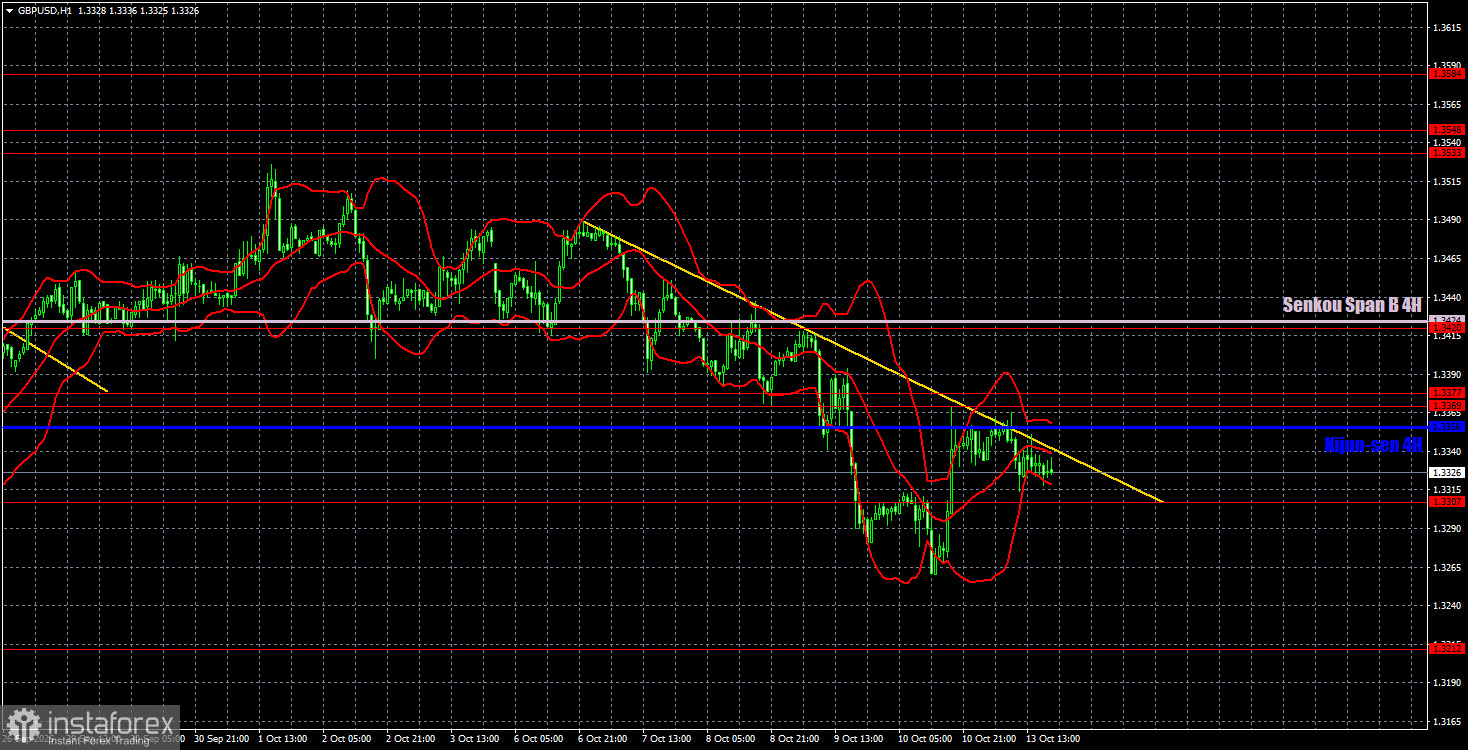
On the hourly timeframe, GBP/USD continues to form a downward trend. This only reinforces how disconnected the movement is from any fundamental basis. The dollar still lacks a major reason to strengthen—so we expect the 2025 uptrend to resume under almost any macroeconomic scenario. For now, the market is waiting for the price to break the trendline and ideally confirm a close above the Ichimoku Kijun-sen line.
On October 14, we highlight the following important levels: 1.3125, 1.3212, 1.3307, 1.3369-1.3377, 1.3420, 1.3533-1.3548, 1.3584, 1.3681, 1.3763, 1.3833, 1.3886. The Senkou Span B (1.3424) and Kijun-sen (1.3356) lines may also be sources of signals. It is recommended to set the Stop Loss level at break-even when the price moves in the right direction by 20 pips. The Ichimoku indicator lines may move during the day, which should be taken into account when determining trading signals.
On Tuesday, the U.K. will publish relatively important reports on unemployment, jobless claims, and wage growth. In the U.S., Jerome Powell is scheduled to speak, but no impactful commentary is expected.
Trading Recommendations
Today, traders can plan entries based on the 1.3369–1.3377 zone or the 1.3307 level. A bounce from 1.3307 would provide a good setup for long positions and may even signal the start of a new uptrend on the hourly chart. A confirmed drop below 1.3307 would make short positions relevant with a near-term target at 1.3212.
Chart Legend:
- Support and resistance levels (thick red lines) – indicate where movement may pause or reverse. They are not automatic trade signals.
- Kijun-sen and Senkou Span B – strong indicator lines from the Ichimoku system, adapted from the 4-hour chart to the 1-hour chart.
- Extremum levels (thin red lines) – past significant highs and lows; potential signal zones.
- Yellow lines – trendlines, channels, and other technical patterns.
- COT Indicator 1 – Shows net position data by trader category.