EUR/USD 5-Minute Analysis
The EUR/USD currency pair could not continue its downward movement on Friday. This is not surprising, as any dollar growth is achieved with significant effort. Regardless of the macroeconomic or fundamental background, if the market refuses to buy the dollar, it will not rise under any circumstances. Thus, on Thursday, we saw a rise in the U.S. currency, and the price broke out of the three-week sideways channel. But all good things come to an end. At this point, the price has corrected to the critical line, so a renewed decline appears logical from a technical perspective. However, it's worth noting that traders still do not favor the dollar.
There were no fundamental or macroeconomic events on Friday. Therefore, it is clear that the recent weakness of the dollar was not caused by any news. As a result, we observe the following pattern: when the dollar has all the reasons to rise, it does so slowly and with difficulty. When there are no reasons for growth, it falls or trades sideways. We doubt the market's ability to continue its downward momentum.
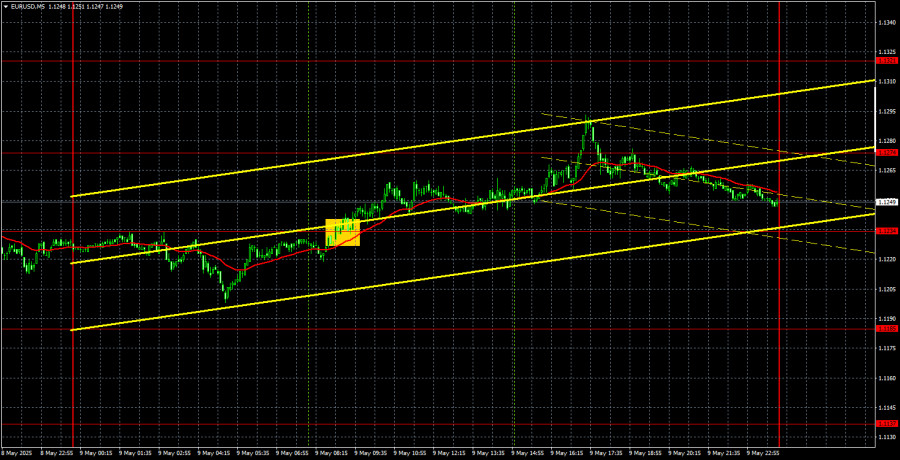
In the 5-minute timeframe, one trade signal worth mentioning was formed. During the European session, the price consolidated above the 1.1234 level, leading to a rise above 1.1274. However, this growth did not last long, so after consolidating below that level, it made sense to exit long positions. Opening new short positions before the market closed for the weekend was likely not the most reasonable decision.
COT Report
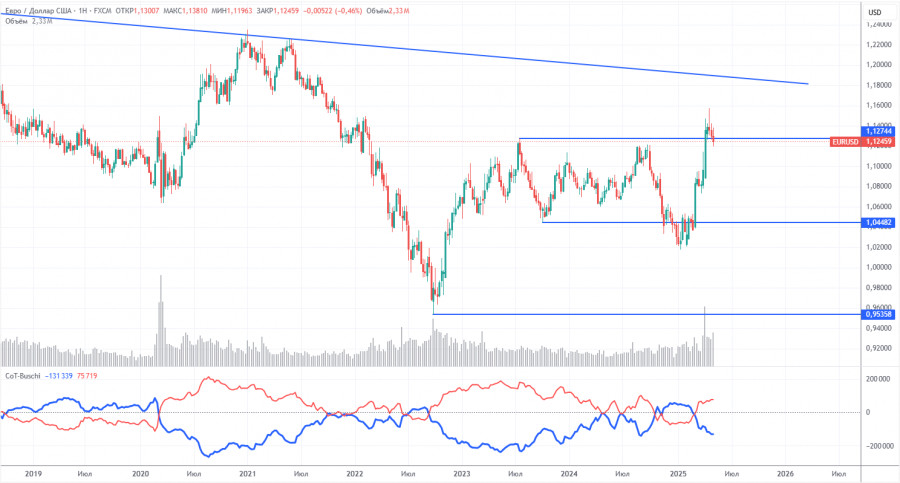
The latest COT (Commitment of Traders) report is dated May 6. As shown in the chart above, the net position of non-commercial traders remained bullish for a long time. Bears briefly took the lead but quickly lost it. Since Trump took office, the dollar has been in free fall. We can't say with certainty that the dollar's decline will continue, and the COT reports reflect the actual sentiment of large players, which can change rapidly under current circumstances.
We still see no fundamental factors for the euro to strengthen, but one major factor remains for the dollar to fall. The pair may continue to correct for several more weeks or months, but a 16-year downtrend will not reverse quickly. Once Trump concludes his trade wars, the dollar may return to growth.
The red and blue lines have crossed again, indicating a return to a bullish trend. Over the last reporting week, the number of longs among the "non-commercial" group decreased by 2,200, and the number of shorts decreased by 2,100. Accordingly, the net position remained virtually unchanged for the week.
EUR/USD 1-Hour Analysis
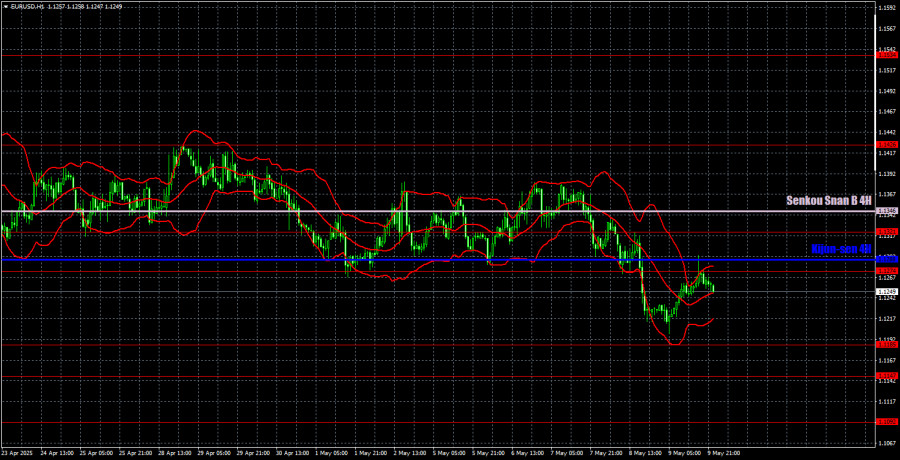
In the hourly timeframe, EUR/USD broke out of the sideways channel, but this does not necessarily mean the downward movement will last another week. There is still little logic or technical clarity in price movements across timeframes. It seems the market is tired of waiting for Trump's new tariffs and has decided to start taking profits in long positions. The Federal Reserve's position on monetary policy may also have played a role. However, we cannot yet say that the "dollar nightmare" is over.
Key trading levels for May 12: 1.0823, 1.0886, 1.0949, 1.1006, 1.1092, 1.1147, 1.1185, 1.1274, 1.1321, 1.1426, 1.1534, 1.1607, 1.1666. Ichimoku indicator lines: Senkou Span B (1.1346), Kijun-sen (1.1288). These lines may move throughout the day and should be considered when identifying trade signals. Don't forget to move your Stop Loss to breakeven if the price moves 15 pips in the correct direction—this protects against potential losses in case of a false signal.
No significant events are scheduled in either the Eurozone or the U.S. on Monday, so we don't expect strong movements during the day. Trading will rely entirely on technical analysis, though EUR/USD does not always behave technically. Caution is advised when opening any positions.
Illustration Explanations:
- Support and resistance price levels – thick red lines where movement may end. They are not trading signal sources.
- Kijun-sen and Senkou Span B lines—These are strong Ichimoku indicator lines transferred to the hourly timeframe from the 4-hour one.
- Extremum levels – thin red lines where the price has previously rebounded. These act as trading signal sources.
- Yellow lines – trend lines, trend channels, and other technical patterns.
- COT Indicator 1 on the charts – the size of the net position for each category of traders.


