EUR/USD 5-Minute Analysis
For most of Friday, the EUR/USD pair continued to drift slowly downward, but closer to the evening, as Jerome Powell began his speech at the Jackson Hole symposium, the market once again rushed to sell the U.S. dollar. We had repeatedly warned that any decline in EUR/USD was merely a technical correction. We also pointed out that, fundamentally, the backdrop provides no support for the dollar. Therefore, the resumption of dollar weakness was only a matter of time. Traders waited for an important event, received a formal reason, and began selling the troubled dollar again.
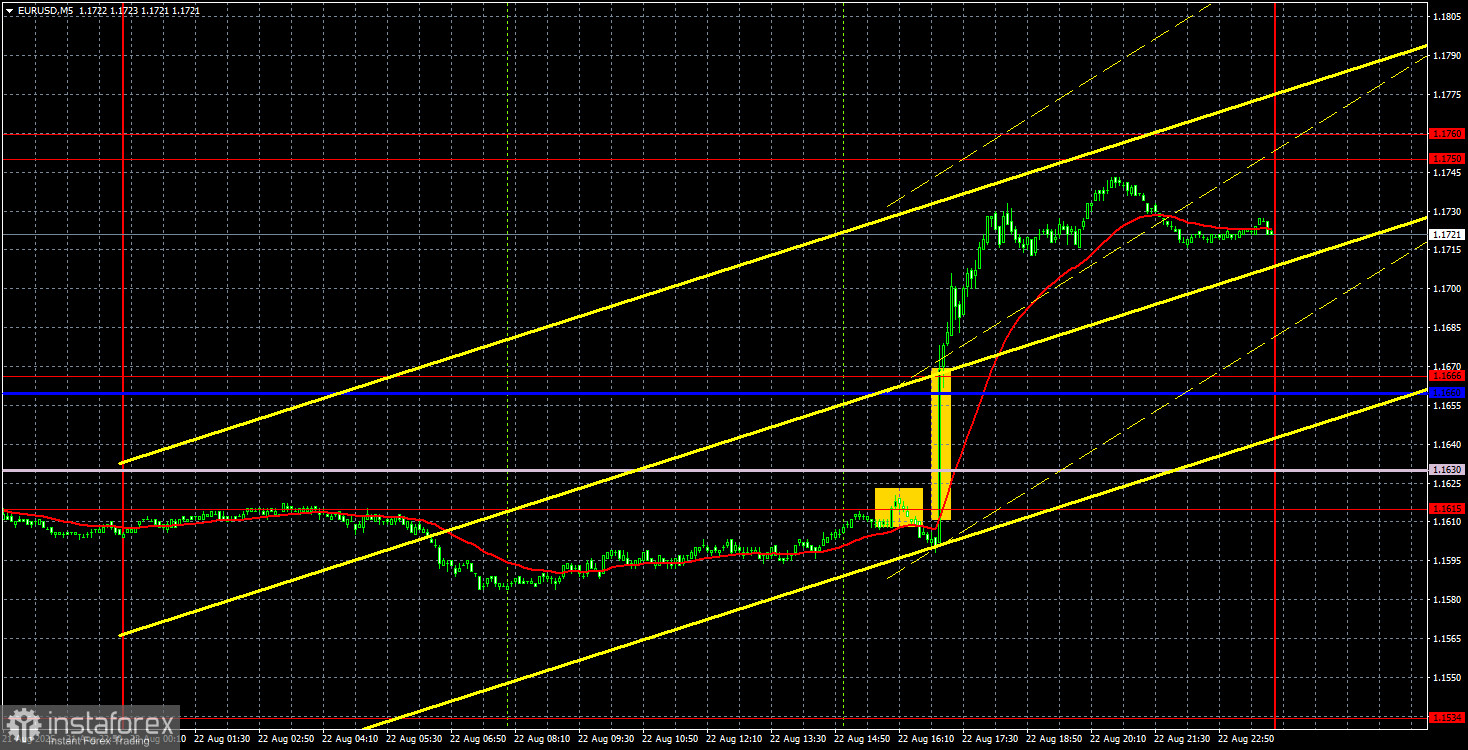
From a technical perspective, the current situation looks almost perfect. In just half an hour, the price broke through the descending trendline, the Ichimoku indicator lines, and two key levels. Thus, a slight pullback downward can be expected, followed by the formation of a new local uptrend, which will be part of the "2025 trend."
On the 5-minute timeframe on Friday, two trading signals formed, but it was extremely difficult to act on them based on pure technicals. The first signal—a rebound from 1.1615—appeared just half an hour before Powell's speech, making it too risky to trade. The second signal formed as Powell began speaking: a breakout of two levels and two lines in just five minutes. It was impossible to react in time. Long positions could only be opened after consolidation above 1.1666, and even such a trade would have yielded at least 45 points of profit.
COT Report
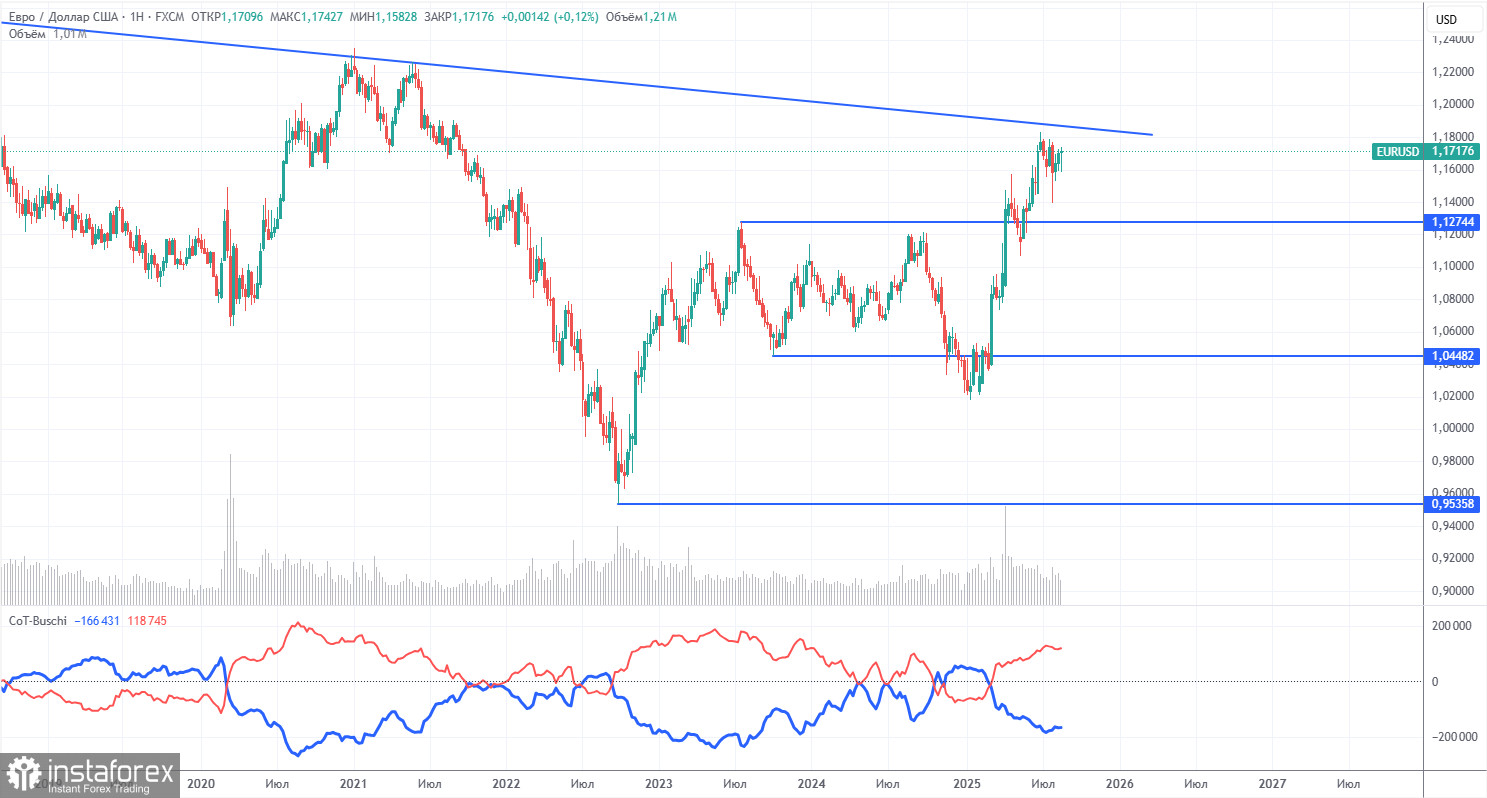
The latest COT report is dated August 19. The chart above clearly shows that the net position of non-commercial traders had long been bullish, while bears only briefly gained dominance at the end of 2024 before quickly losing it again. Since Donald Trump assumed the U.S. presidency, the dollar has been the only currency in decline. We cannot say with 100% certainty that this will continue, but current global developments strongly point in that direction.
We still see no fundamental factors supporting the euro's rise, but there remain plenty of factors weighing on the dollar. The global downtrend in the U.S. currency continues, and what does it matter now where the price moved in the past 17 years? Once Trump ends his trade wars, the dollar may rise again, but recent events show the wars will persist in one form or another.
The positions of the red and blue lines on the indicator continue to signal a bullish trend. During the last reporting week, long positions among the "Non-commercial" group increased by 6,400, while shorts rose by 3,100. As a result, the net position rose by 3,400, a minor change.
EUR/USD 1-Hour Analysis
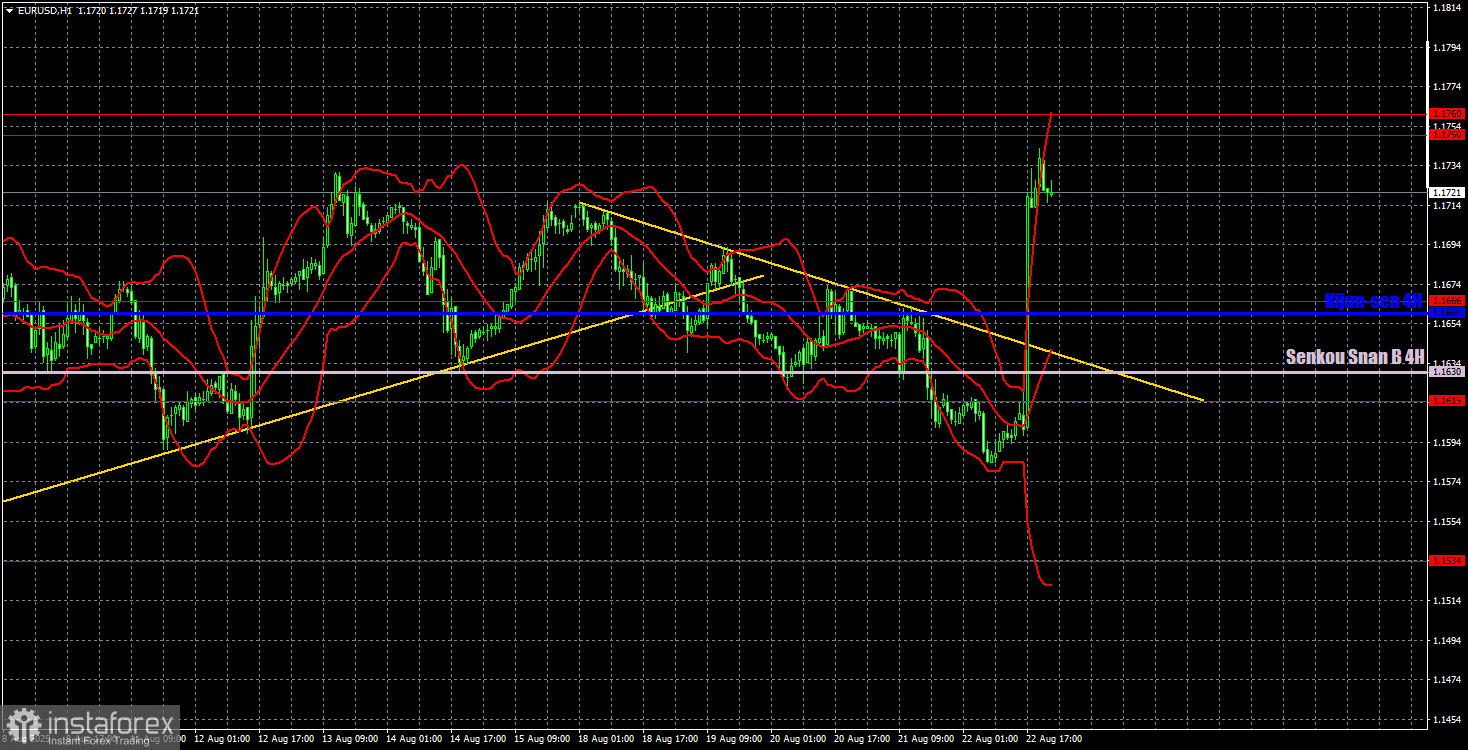
On the hourly timeframe, EUR/USD took its first step toward forming a new uptrend. The global factors behind the dollar's decline, which we have consistently discussed, came into play on Friday during Powell's speech. We continue to see no grounds for a medium-term dollar rally. Technically, trends are now upward across nearly all timeframes.
For August 25, we highlight the following trading levels: 1.1092, 1.1147, 1.1185, 1.1234, 1.1274, 1.1362, 1.1426, 1.1534, 1.1615, 1.1666, 1.1750–1.1760, 1.1846–1.1857, as well as Senkou Span B (1.1630) and Kijun-sen (1.1660). Ichimoku lines may shift during the day, which should be considered when identifying trading signals. Remember to place a Stop Loss at breakeven if the price moves 15 pips in the right direction—this will protect against losses if the signal turns out false.
On Monday, the calendar is empty. Germany will release its business climate report, but who seriously cares about such data right now?
Trading Recommendations
On Monday, the upward movement may well continue, though a downward correction after Friday's "surge" should not be ruled out. Since there will be no macroeconomic background, trading will have to rely solely on technical levels and lines. Therefore, this week we expect renewed growth of the euro, while keeping in mind possible technical pullbacks.
Illustration Explanations:
- Support and resistance price levels – thick red lines where movement may end. They are not trading signal sources.
- Kijun-sen and Senkou Span B lines—These are strong Ichimoku indicator lines transferred to the hourly timeframe from the 4-hour one.
- Extremum levels – thin red lines where the price has previously rebounded. These act as trading signal sources.
- Yellow lines – trend lines, trend channels, and other technical patterns.
- COT Indicator 1 on the charts – the size of the net position for each category of traders.