Trade Breakdown for Wednesday:
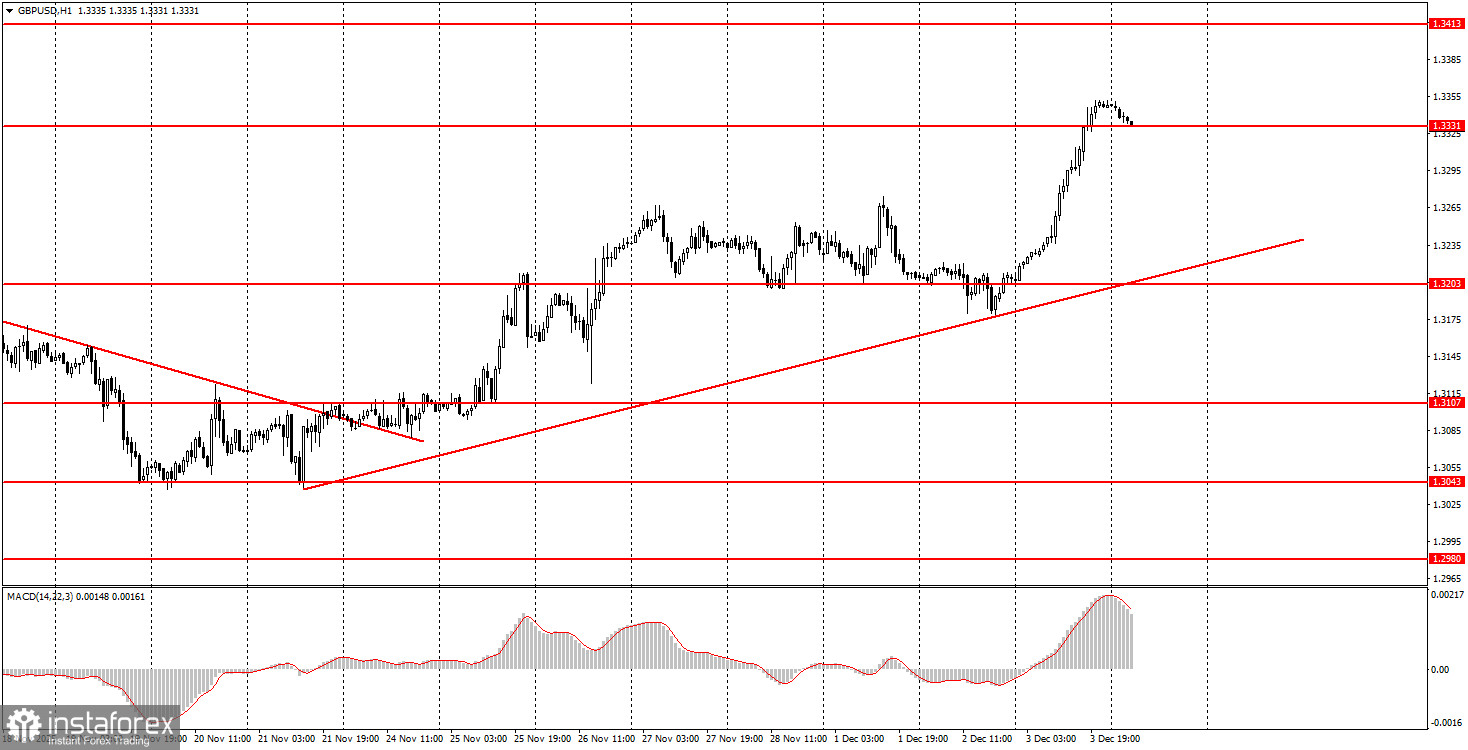
1H Chart of GBP/USD

The GBP/USD pair showed a strong upward movement on Wednesday, which may seem strange to many beginners. Indeed, in the UK, only a single services sector business activity index was published, while U.S. data came out after the pair had already made most of its upward journey. In other words, the British pound started to rise during the night when there were no news events, except for some vague remarks from Donald Trump. However, there was nothing new in the statements about the appointment of the new Fed head. Trump mentioned back in the summer that he would soon announce the name of the new central bank chairman. Thus, the macroeconomic background corresponded to the rise of the pair but did not provoke it. If you regularly read our articles, you know that the British pound has been severely oversold for a long time, while the U.S. dollar has risen for two consecutive months, often without solid reasons. The global upward trend is maintained, so any local rise is, by default, justified.
5M Chart of GBP/USD
On the 5-minute timeframe, several trading signals were formed yesterday. During the night, the pair broke through the 1.3203-1.3211 range, allowing long positions to be opened. We understand that most traders are resting at night, but the currency market operates 24/7. Thus, signals can form at any time. Subsequently, three more buy signals were generated, each allowing traders to either open new long positions or maintain already open ones.
How to Trade on Thursday:
On the hourly timeframe, the GBP/USD pair has resumed forming a local upward trend. As we already mentioned, there are no global grounds for medium-term dollar growth, which leads us to expect only upward movement. The correction/flat on the daily timeframe may not yet be complete, but any local trend on the hourly timeframe is potentially a resumption of the global trend.
On Thursday, beginner traders can expect trading signals to form in the 1.3329-1.3331 range. A bounce from this area upwards will allow opening new long positions with a target at 1.3413. A consolidation below this area will lead to short positions with targets set at 1.3259-1.3267.
On the 5-minute timeframe, trading can currently be done at the following levels: 1.2913, 1.2980-1.2993, 1.3043, 1.3096-1.3107, 1.3203-1.3211, 1.3259-1.3267, 1.3329-1.3331, 1.3413-1.3421, 1.3466-1.3475, 1.3529-1.3543, 1.3574-1.3590. On Thursday, the UK construction sector activity index is scheduled for release, while in the U.S., unemployment claims will be released. Both reports are considered secondary; therefore, volatility may be low, and beginner traders will need to pay more attention to technical analysis.
Key Rules of the Trading System:
- The strength of a signal is assessed by the time it takes to form the signal (bounce or breakout). The less time it takes, the stronger the signal.
- If two or more trades were opened near any level based on false signals, all subsequent signals from that level should be ignored.
- In a flat, any pair can create numerous false signals or none at all. In any case, it's better to stop trading at the first signs of a flat.
- Trades are opened during the period between the start of the European session and the middle of the American session, after which all trades must be closed manually.
- On the hourly timeframe, when trading based on signals from the MACD indicator, it is preferable to trade only when good volatility is present, and a trend is confirmed by a trend line or channel.
- If two levels are positioned too closely to each other (5 to 20 points), they should be viewed as a support or resistance area.
- After moving 20 pips in the right direction, set the Stop Loss to breakeven.
Chart Explanation:
- Support and Resistance Levels: Levels that serve as targets for opening buys or sells. Take Profit levels can be placed near them.
- Red Lines: Channels or trend lines that reflect the current trend and indicate the preferred direction for trading.
- MACD Indicator (14, 22, 3): A histogram and signal line, a supplementary indicator that can also be used as a source of signals.
Important Note: Significant speeches and reports (always included in the news calendar) can greatly influence the movement of the currency pair. Therefore, during their release, it is advisable to trade cautiously or exit the market to avoid sharp reversals against the preceding movement.
Remember: For beginners trading in the Forex market, it is important to understand that not every trade can be profitable. Developing a clear strategy and practicing money management are keys to long-term trading success.