empty
 
 
27.10.2025 07:42 AM
How to Trade the GBP/USD Currency Pair on October 27? Simple Tips and Trade Analysis for Beginners

Trade Analysis for Friday:

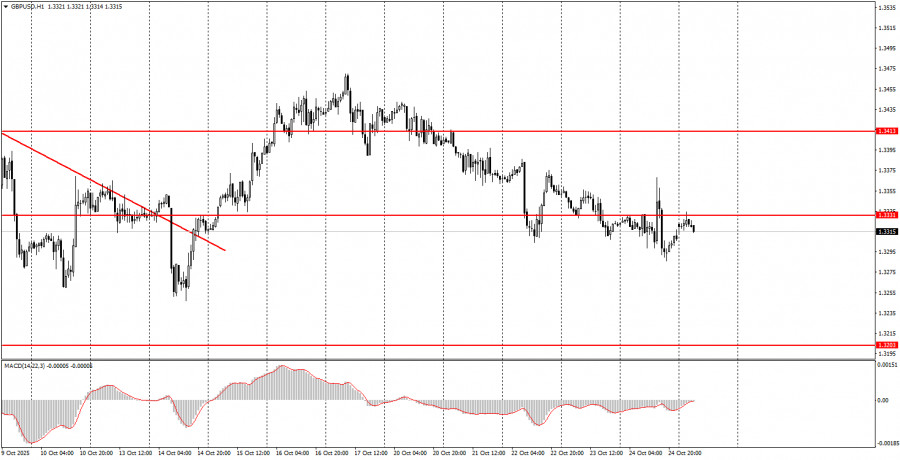
1H Chart of the GBP/USD Pair

This image is no longer relevant

The GBP/USD pair traded completely illogically on Friday. From the very morning, the market had decent grounds for buying the British currency, which would have been fully supported by the current technical picture and the global fundamental backdrop. In the UK, business activity indices for the services and manufacturing sectors for October, as well as retail sales data, were published. All three reports exceeded analysts' expectations, providing substantial reasons for buying. Yet we did not observe any market reaction, even a minimal one, to the relatively positive UK reports.

In the U.S., the inflation report was released, which logically prompted a drop in the dollar that lasted... 5 minutes. Subsequently, the dollar rose more sharply, seemingly out of nowhere, than it had fallen, driven by strong conditions. It is hard to argue that the positive S&P business activity indices are more significant reports than the inflation and consumer sentiment indices, which did not favor the dollar. Thus, we again saw weak and illogical movements that contradict everything.

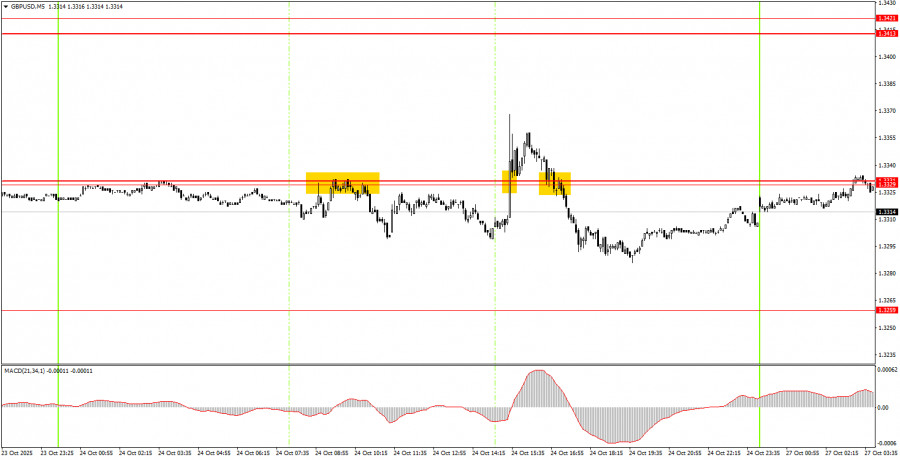
5M Chart of the GBP/USD Pair

This image is no longer relevant

On the 5-minute timeframe, several trading signals formed on Friday, but all proved false. We have been discussing the illogical movements for several weeks now, so this is not surprising. Beginner traders may attempt to act on the forming signals, but they should remember that movements are currently weak and illogical, as the daily timeframe remains in a sideways trend.

How to Trade on Monday:

On the hourly timeframe, the GBP/USD pair has begun forming a new upward trend, which could mark the start of a new phase in the global upward trend. However, for over a week now, the quotes have only declined. As previously mentioned, there are no grounds for prolonged dollar growth, so we anticipate only upside movements in the medium term. Presently, market volatility has dropped to near zero, and the price is still slow to move upwards.

On Monday, the GBP/USD pair may attempt to resume its upward movement, but no significant news is expected today. To open long positions, a breakout above the 1.3329-1.3331 range is required. A rebound from this area from below will allow for short positions targeting 1.3259. It should be noted that movements based on any signals may be very weak.

On the 5-minute timeframe, trading can currently occur at the following levels: 1.3102-1.3107, 1.3203-1.3211, 1.3259, 1.3329-1.3331, 1.3413-1.3421, 1.3466-1.3475, 1.3529-1.3543, 1.3574-1.3590, 1.3643-1.3652, 1.3682, 1.3763. On Monday, no important reports or events are scheduled in either the UK or the U.S.

Key Principles of My Analysis:

  1. The strength of a signal is determined by the time it takes to form the signal (bounce or breakout level). The shorter the time, the stronger the signal.
  2. If two or more trades were opened near any level based on false signals, all subsequent signals from that level should be ignored.
  3. In a sideways market, any pair can generate many false signals or none at all. In any case, at the first signs of a sideways trend, it is advisable to stop trading.
  4. Trades should be opened during the period between the start of the European session and midway through the American session, and all trades should be closed manually thereafter.
  5. On the hourly timeframe, it is preferable to trade MACD signals only when volatility is high and a trendline or channel supports the trend.
  6. If two levels are too close together (5 to 20 pips), consider them a support or resistance zone.
  7. If the price moves 20 pips in the correct direction, adjust the Stop Loss to breakeven.

What's on the Charts:

Support and Resistance Levels: These levels serve as targets when opening buy or sell positions. Take Profit levels can be placed around these areas.

Red Lines: These represent channels or trend lines that illustrate the current trend and indicate the preferred trading direction.

MACD Indicator (14,22,3): This consists of a histogram and a signal line; it is a supplementary indicator that can also be used as a source of signals.

Important speeches and reports (always included in the news calendar) can significantly impact the movement of currency pairs. Therefore, during their release times, it is crucial to trade with caution or exit the market to avoid sharp reversals against previous movements.

Beginner traders in the Forex market should remember that not every trade can be profitable. Developing a clear strategy and effective money management are essential for long-term success in trading.

Summary
Urgency
Analytic
Stanislav Polyanskiy
Start trade
Gana con los cambios en el valor de las criptomonedas con InstaForex.
Descarga MetaTrader 4 y abre tu primera operación.
  • Grand Choice
    Contest by
    InstaForex
    InstaForex always strives to help you
    fulfill your biggest dreams.
    UNIRSE AL CONCURSO
  • Depósito al azar
    ¡Haga un depósito en su cuenta de $3,000 y obtenga $1000 más!
    ¡En Octubre, sorteamos $1000 dentro de la campaña Depósito afortunado!
    Obtenga la oportunidad de ganar depositando $3,000 en una cuenta de operaciones. Tras haber cumplido esta condición, se convertirá en un participante de la campaña.
    UNIRSE AL CONCURSO
  • Opere de forma inteligente, gane un dispositivo
    Recargue su cuenta con al menos $500, regístrese en el concurso y tenga la oportunidad de ganar dispositivos móviles.
    UNIRSE AL CONCURSO
  • 100% de bonificación
    Su oportunidad única de obtener un bono del 100 % en su depósito
    OBTENER BONO
  • 55% de bonificación
    Solicite un bono del 55% en cada depósito
    OBTENER BONO
  • 30% de bonificación
    Reciba un bono del 30% cada vez que recargue su cuenta
    OBTENER BONO

Recommended Stories

¿No puede hablar ahora mismo?
Ingrese su pregunta en el chat.
Widget callback