GBP/USD 5-Minute Analysis
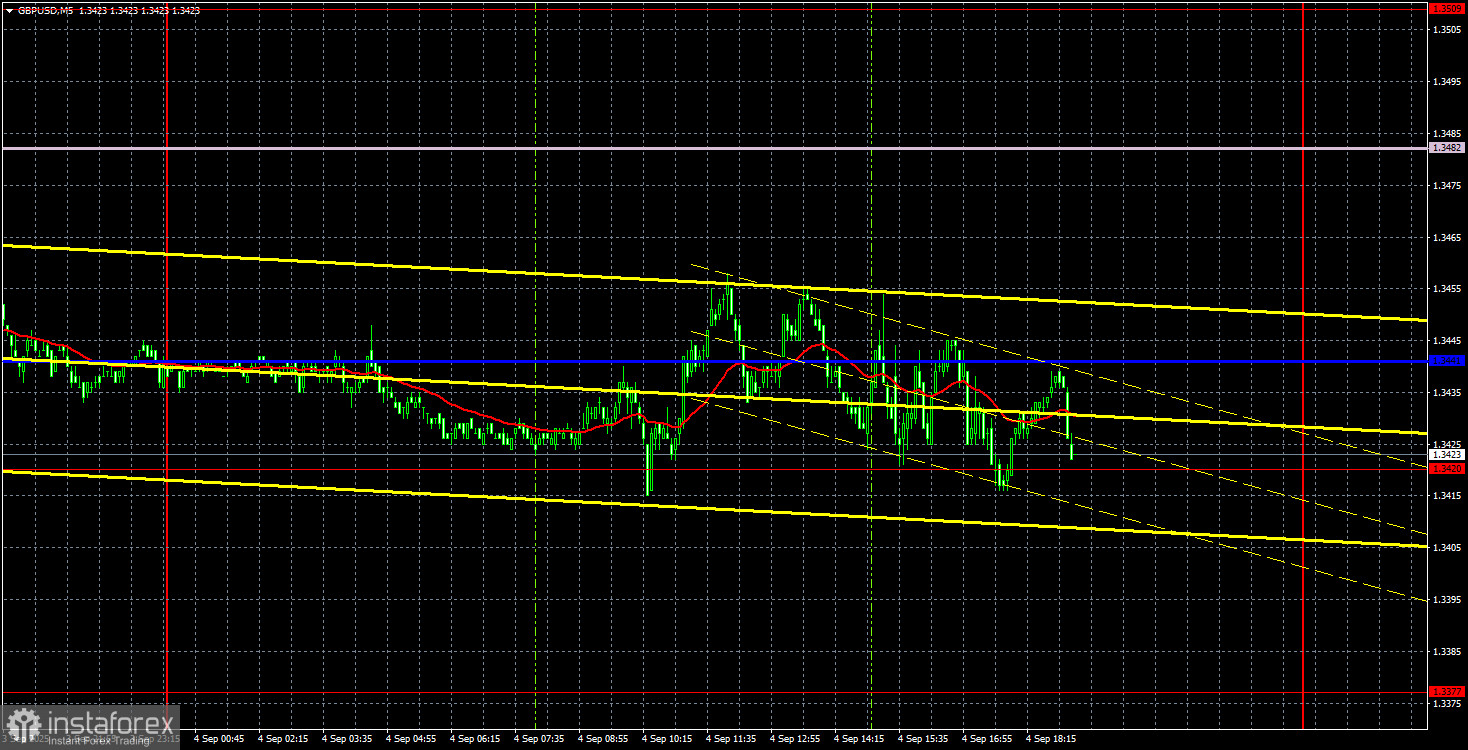
The GBP/USD currency pair also traded very weakly on Thursday. After the British currency recovered on Wednesday, bulls were unable to break through the Ichimoku indicator lines, leading to a bounce that once again opens the door for some decline in quotes. In the EUR/USD analysis, we have already discussed these "convulsions" in price. The pound's situation is no better right now. We continue to see the formation of a downward correction, which is most likely just a correction on the daily timeframe. Thus, this correction could last for quite some time. The price movement is very close to a flat range.
Yesterday, the US dollar had some reason to climb slightly, as the US ISM Services PMI exceeded expectations. However, it cannot be said that the market rushed to act upon this fairly significant report. The reaction was very muted. Today, the "reports of the week" will be published, but we are now uncertain whether there will be a logical or adequate market response. There will probably also be surprises in the pair's movements today.
On the 5-minute chart, the pair's movements are so evident that almost no explanation is needed. The pair spent the whole day bouncing up and down, ignoring everything. Even after the ISM release in the US, the market situation didn't change. Thus, the downward corrective trend continues, but whether it is worth trading is a question each trader must answer for themselves.
COT Report
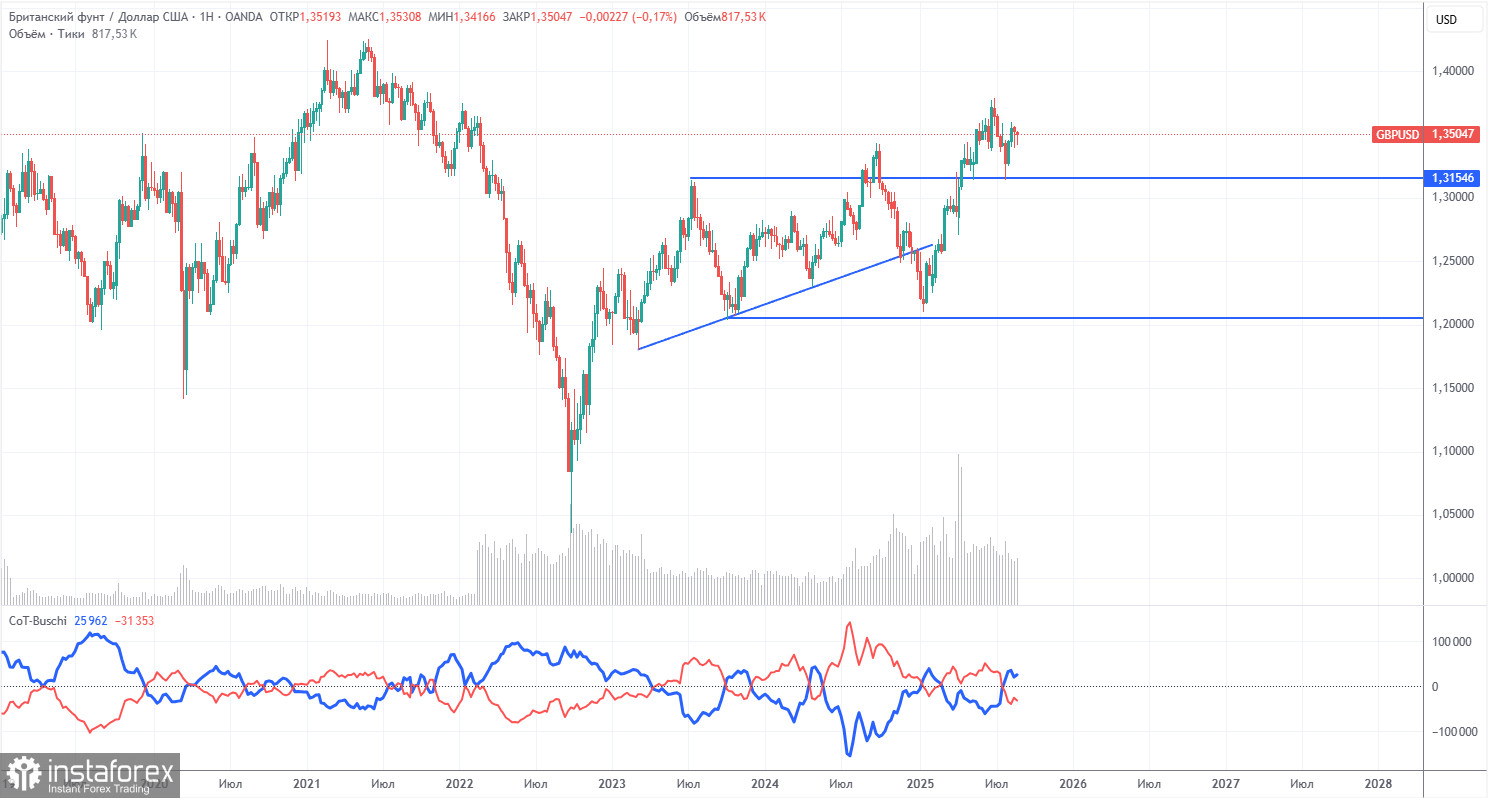
COT reports for the British pound indicate that over recent years, the sentiment of commercial traders has shifted constantly. The red and blue lines, reflecting net positions of commercial and non-commercial traders, frequently cross and usually close to zero. Currently, they're almost level, indicating a nearly equal number of buy and sell positions.
The dollar continues to weaken due to Trump's policy, so market makers' demand for sterling is not particularly important right now. The trade war is likely to persist in some form for an extended period. The Federal Reserve will be forced to cut rates at some point in the coming year. Demand for the dollar will decline anyway. According to the latest report on the pound, the "Non-commercial" group closed 5,300 BUY contracts and opened 800 SELL contracts. Thus, the net position of non-commercial traders shrank by 6,100 contracts over the reporting week.
In 2025, the pound strengthened greatly, but this was for one reason: Trump's policy. As soon as this is neutralized, the dollar could resume rising—but no one knows when that will happen. It doesn't matter how fast the net position of the pound rises or falls. For the dollar, it continues to decline, usually at a faster pace.
GBP/USD 1-Hour Analysis
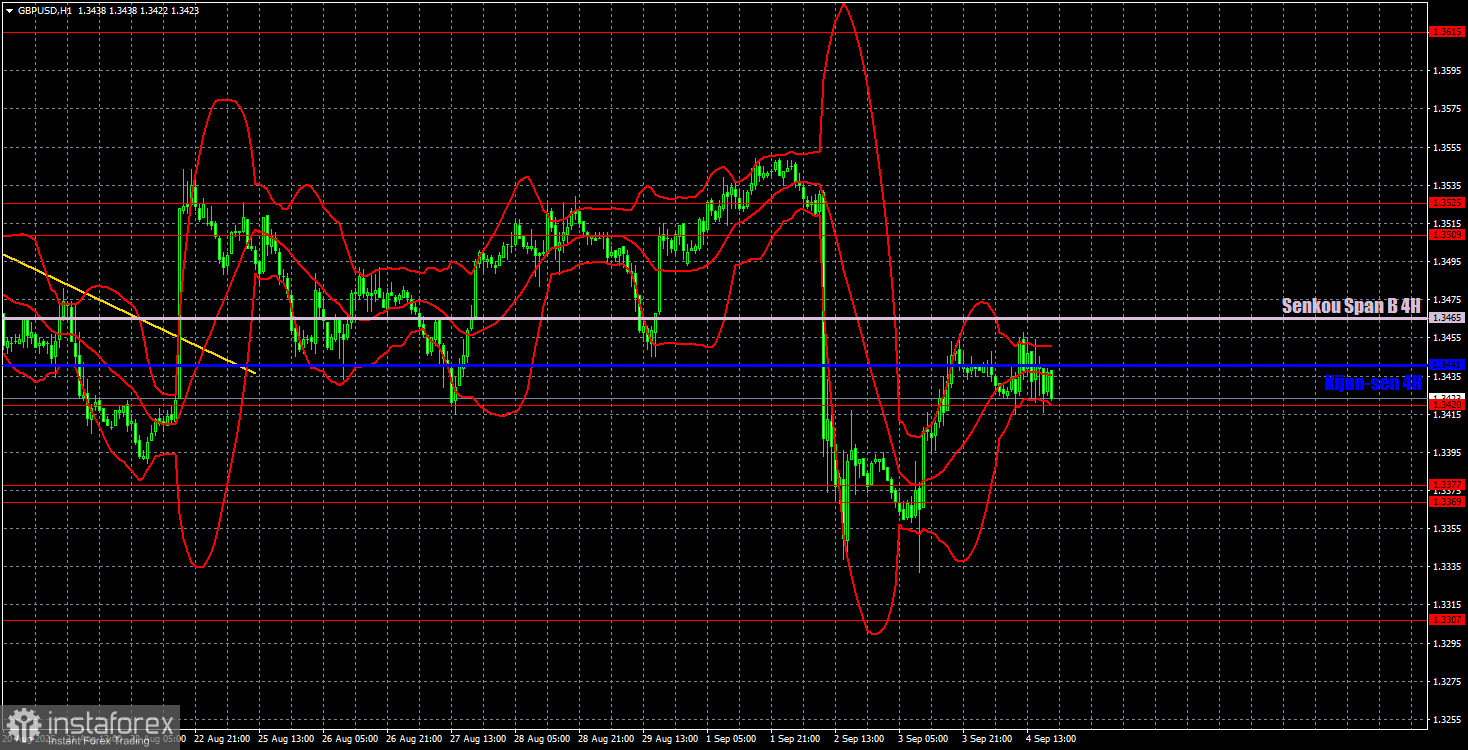
On the hourly chart, GBP/USD is poised to initiate a new uptrend, but Tuesday's trading disrupted the technical picture, and on Thursday, the pound failed to break through the Kijun-sen and Senkou Span B lines. In our view, GBP/USD has corrected enough over recent weeks to resume the global uptrend that began back in January. The fundamental and macro background hasn't changed in recent weeks, so there is still no reason to expect a medium-term dollar rally. However, the correction continues for now.
For September 5, we highlight the following important levels: 1.3125, 1.3212, 1.3369–1.3377, 1.3420, 1.3509–1.3525, 1.3615, 1.3681, 1.3763, 1.3833, 1.3886. Senkou Span B (1.3465) and Kijun-sen (1.3441) lines can also serve as signal sources. The Stop Loss should be moved to breakeven after a 20-point move in your favor. Ichimoku indicator lines may shift during the day, so keep this in mind when identifying trading signals.
On Friday, no significant events are scheduled in the UK, while in the US, reports will be published that could determine the fate of the dollar for the coming weeks. It's difficult to expect positive labor and unemployment numbers out of the US right now, but it's important to remember that what matters isn't just the numbers themselves, but how they compare to forecasts.
Trading Recommendations
We believe that on Friday, the decline in GBP/USD rates could persist, since the Ichimoku indicator lines were not breached. At the same time, US data in the afternoon may sharply change trader sentiment.
Illustration Explanations:
- Support and resistance price levels – thick red lines where movement may end. They are not trading signal sources.
- Kijun-sen and Senkou Span B lines—These are strong Ichimoku indicator lines transferred to the hourly timeframe from the 4-hour one.
- Extremum levels – thin red lines where the price has previously rebounded. These act as trading signal sources.
- Yellow lines – trend lines, trend channels, and other technical patterns.
- Indicator 1 on the COT charts – the size of the net position for each category of traders.