

signal strength 2 of 5
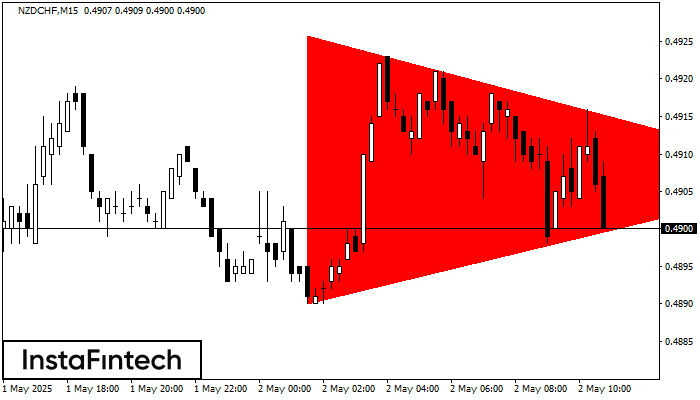
According to the chart of M15, NZDCHF formed the Bearish Symmetrical Triangle pattern. Description: The lower border is 0.4890/0.4907 and upper border is 0.4926/0.4907. The pattern width is measured on the chart at -36 pips. The formation of the Bearish Symmetrical Triangle pattern evidently signals a continuation of the downward trend. In other words, if the scenario comes true and NZDCHF breaches the lower border, the price could continue its move toward 0.4884.
The M5 and M15 time frames may have more false entry points.
See Also
- All
- Double Top
- Flag
- Head and Shoulders
- Pennant
- Rectangle
- Triangle
- Triple top
- All
- #AAPL
- #AMZN
- #Bitcoin
- #EBAY
- #FB
- #GOOG
- #INTC
- #KO
- #MA
- #MCD
- #MSFT
- #NTDOY
- #PEP
- #TSLA
- #TWTR
- AUDCAD
- AUDCHF
- AUDJPY
- AUDUSD
- EURCAD
- EURCHF
- EURGBP
- EURJPY
- EURNZD
- EURRUB
- EURUSD
- GBPAUD
- GBPCHF
- GBPJPY
- GBPUSD
- GOLD
- NZDCAD
- NZDCHF
- NZDJPY
- NZDUSD
- SILVER
- USDCAD
- USDCHF
- USDJPY
- USDRUB
- All
- M5
- M15
- M30
- H1
- D1
- All
- Buy
- Sale
- All
- 1
- 2
- 3
- 4
- 5
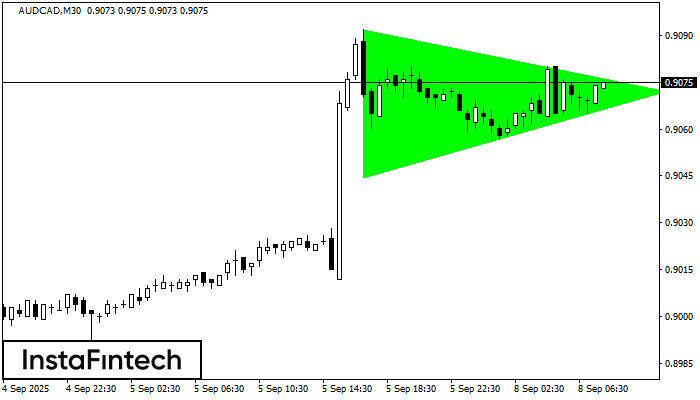
According to the chart of M30, AUDCAD formed the Bullish Symmetrical Triangle pattern. Description: This is the pattern of a trend continuation. 0.9092 and 0.9045 are the coordinates
Open chart in a new window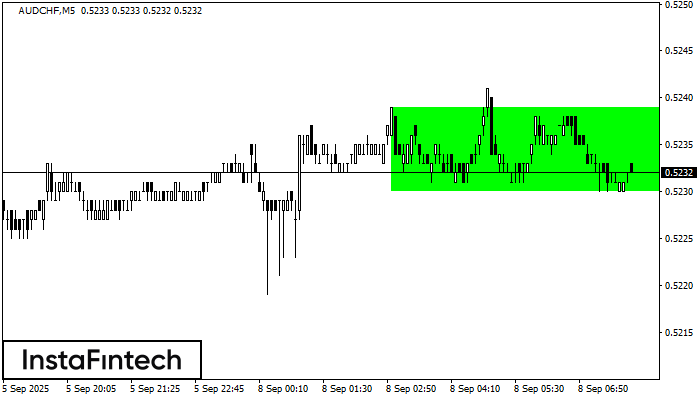
According to the chart of M5, AUDCHF formed the Bullish Rectangle. The pattern indicates a trend continuation. The upper border is 0.5239, the lower border is 0.5230. The signal means
The M5 and M15 time frames may have more false entry points.
Open chart in a new window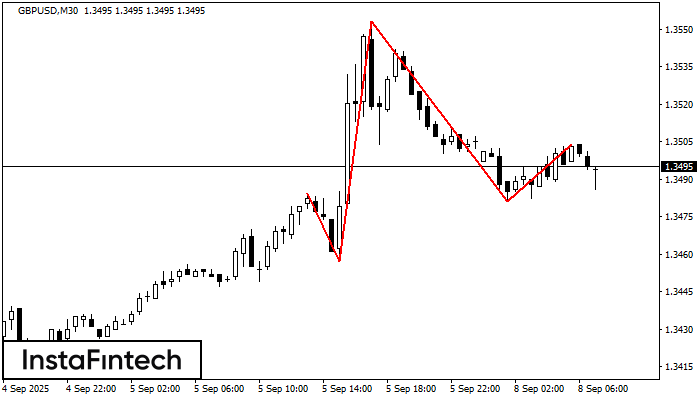
The technical pattern called Head and Shoulders has appeared on the chart of GBPUSD M30. There are weighty reasons to suggest that the price will surpass the Neckline 1.3457/1.3481 after
Open chart in a new window


