signal strength 1 of 5
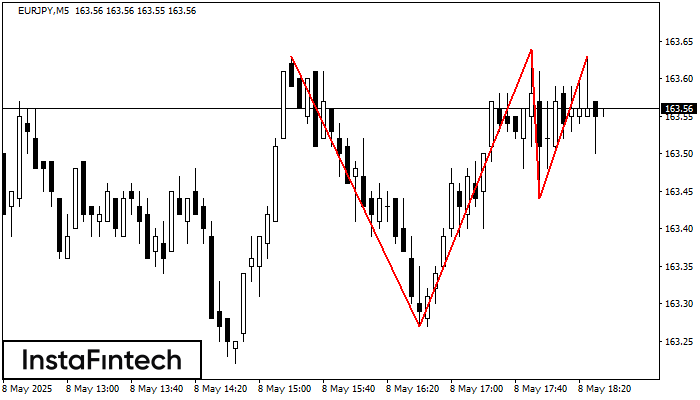
The Triple Top pattern has formed on the chart of the EURJPY M5 trading instrument. It is a reversal pattern featuring the following characteristics: resistance level 0, support level -17, and pattern’s width 36. Forecast If the price breaks through the support level 163.27, it is likely to move further down to 163.49.
The M5 and M15 time frames may have more false entry points.
Veja também
- All
- Double Top
- Flag
- Head and Shoulders
- Pennant
- Rectangle
- Triangle
- Triple top
- All
- #AAPL
- #AMZN
- #Bitcoin
- #EBAY
- #FB
- #GOOG
- #INTC
- #KO
- #MA
- #MCD
- #MSFT
- #NTDOY
- #PEP
- #TSLA
- #TWTR
- AUDCAD
- AUDCHF
- AUDJPY
- AUDUSD
- EURCAD
- EURCHF
- EURGBP
- EURJPY
- EURNZD
- EURRUB
- EURUSD
- GBPAUD
- GBPCHF
- GBPJPY
- GBPUSD
- GOLD
- NZDCAD
- NZDCHF
- NZDJPY
- NZDUSD
- SILVER
- USDCAD
- USDCHF
- USDJPY
- USDRUB
- All
- M5
- M15
- M30
- H1
- D1
- All
- Buy
- Sale
- All
- 1
- 2
- 3
- 4
- 5
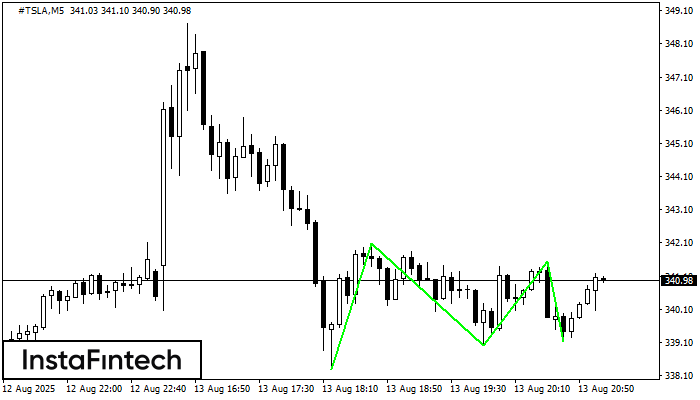
O padrão Fundo triplo foi formado em #TSLA M5. Possui as seguintes características: nível de resistência 342.09/341.55; nível de suporte 338.30/339.14; a largura é de 379 pontos. Se houver
Os intervalos M5 e M15 podem ter mais pontos de entrada falsos.
Open chart in a new window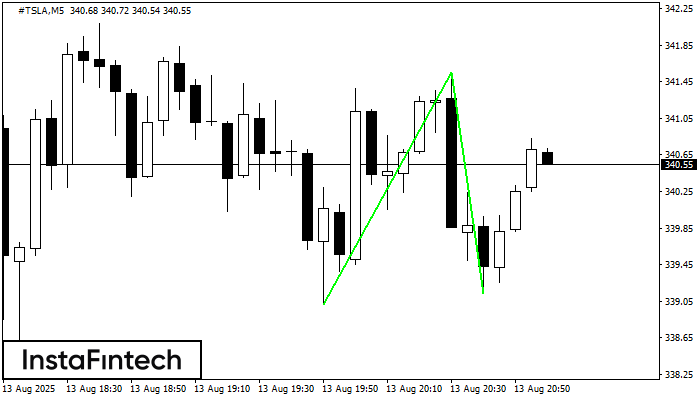
O padrão Fundo duplo foi formado em #TSLA M5. Características: o nível de suporte 339.01; o nível de resistência 341.55; a largura do padrão 254 pontos. Se o nível
Os intervalos M5 e M15 podem ter mais pontos de entrada falsos.
Open chart in a new window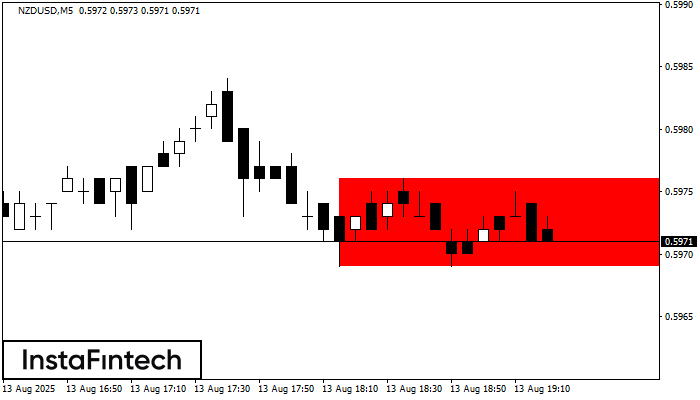
De acordo com o gráfico de M5, NZDUSD formou Retângulo de baixa. O padrão indica uma continuação da tendência. O limite superior é 0.5976, o limite inferior é 0.5969
Os intervalos M5 e M15 podem ter mais pontos de entrada falsos.
Open chart in a new window