signal strength 1 of 5
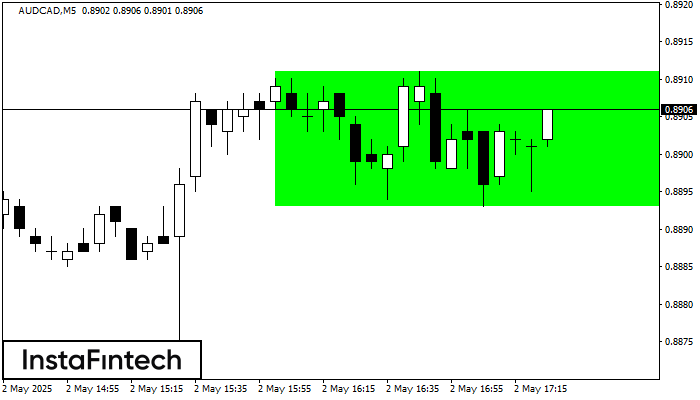
According to the chart of M5, AUDCAD formed the Bullish Rectangle. This type of a pattern indicates a trend continuation. It consists of two levels: resistance 0.8911 and support 0.8893. In case the resistance level 0.8911 - 0.8911 is broken, the instrument is likely to follow the bullish trend.
The M5 and M15 time frames may have more false entry points.
Veja também
- All
- Double Top
- Flag
- Head and Shoulders
- Pennant
- Rectangle
- Triangle
- Triple top
- All
- #AAPL
- #AMZN
- #Bitcoin
- #EBAY
- #FB
- #GOOG
- #INTC
- #KO
- #MA
- #MCD
- #MSFT
- #NTDOY
- #PEP
- #TSLA
- #TWTR
- AUDCAD
- AUDCHF
- AUDJPY
- AUDUSD
- EURCAD
- EURCHF
- EURGBP
- EURJPY
- EURNZD
- EURRUB
- EURUSD
- GBPAUD
- GBPCHF
- GBPJPY
- GBPUSD
- GOLD
- NZDCAD
- NZDCHF
- NZDJPY
- NZDUSD
- SILVER
- USDCAD
- USDCHF
- USDJPY
- USDRUB
- All
- M5
- M15
- M30
- H1
- D1
- All
- Buy
- Sale
- All
- 1
- 2
- 3
- 4
- 5
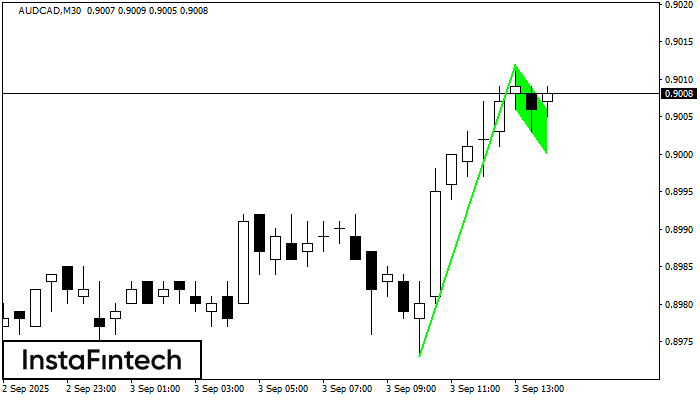
The Bullish Flag pattern has been formed on AUDCAD at M30. The lower boundary of the pattern is located at 0.9006/0.9000, while the higher boundary lies at 0.9012/0.9006. The projection
Открыть график инструмента в новом окне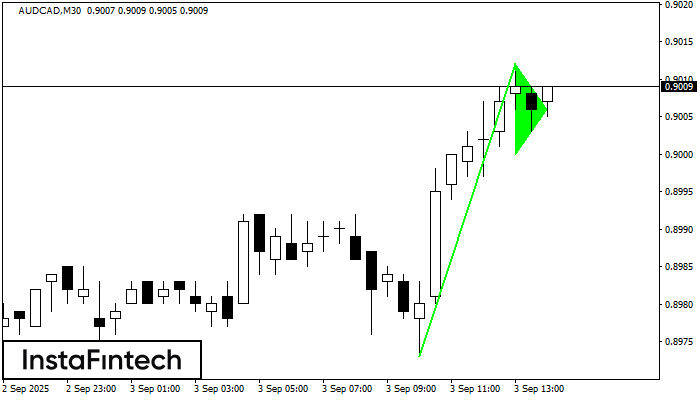
The Bullish pennant graphic pattern has formed on the AUDCAD M30 instrument. This pattern type falls under the category of continuation patterns. In this case, if the quote can breaks
Открыть график инструмента в новом окне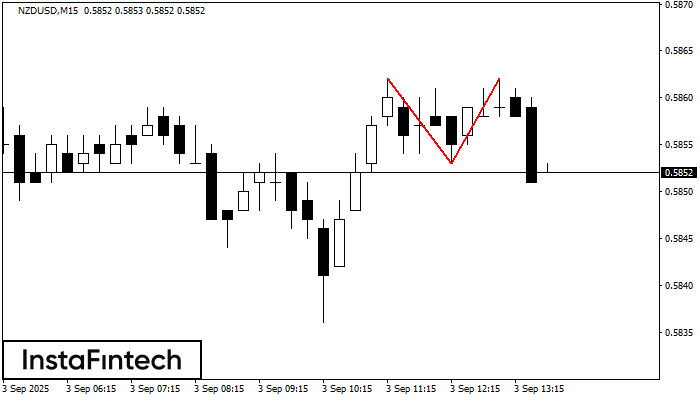
On the chart of NZDUSD M15 the Double Top reversal pattern has been formed. Characteristics: the upper boundary 0.5862; the lower boundary 0.5853; the width of the pattern 9 points
The M5 and M15 time frames may have more false entry points.
Открыть график инструмента в новом окне