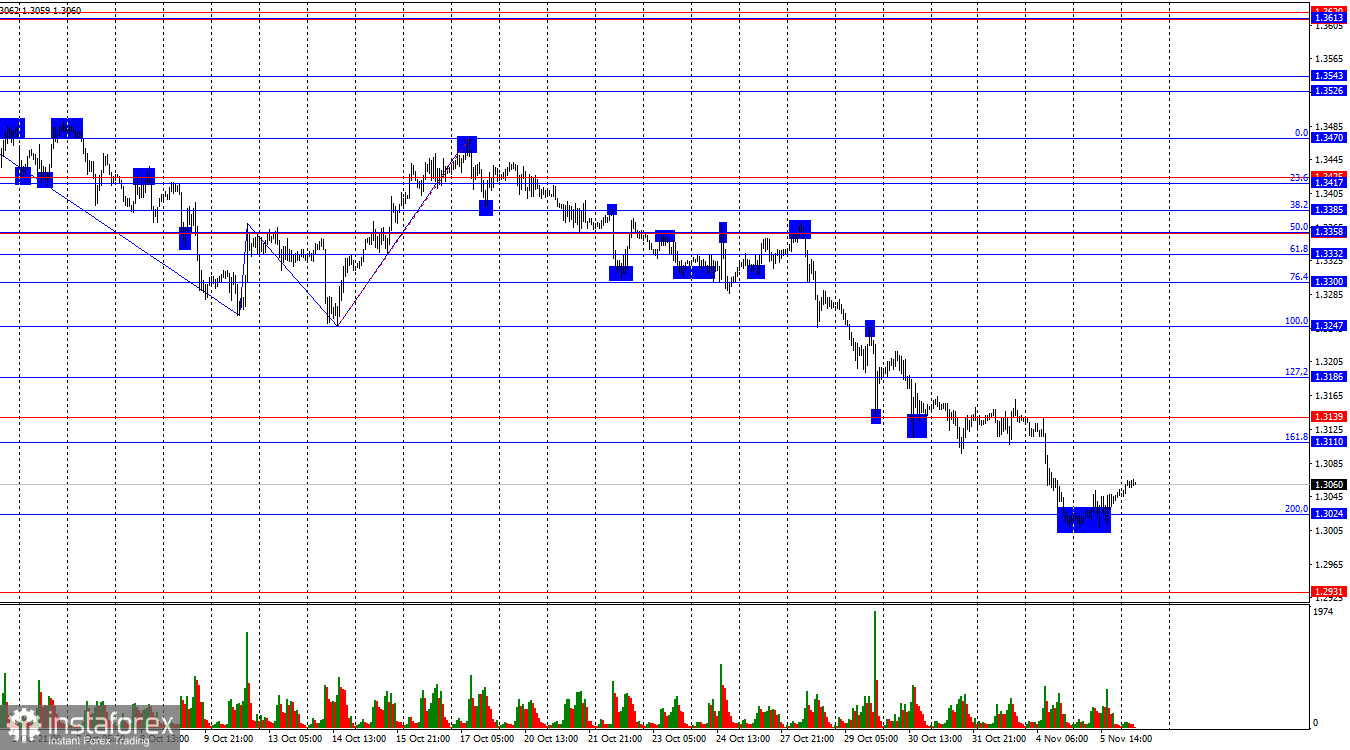
On the hourly chart, the GBP/USD pair on Wednesday rebounded from the 200.0% Fibonacci correction level at 1.3024, turned in favor of the British pound, and began to rise toward the 161.8% Fibonacci level at 1.3110. A consolidation of the pair's rate below 1.3024 would signal a continuation of the pound's decline toward the next level at 1.2931.
The wave structure remains bearish. The last completed upward wave broke the previous high, while the most recent downward wave (which has been forming for three weeks now) long ago broke the previous low. The news background in recent weeks has been negative for the U.S. dollar, yet bullish traders have not taken advantage of the opportunities to go on the offensive. Last week, they sharply retreated from the market, despite the Federal Reserve's rate cut, and have continued to withdraw this week despite the news flow.
On Wednesday, the background allowed the bears to continue their attack, but they failed to overcome the 1.3024 level. Bears have been attacking continuously for three weeks straight — even they need a pause. It's worth recalling that the news background rarely supports the U.S. dollar, but the British pound has its own risk factor — U.K. Chancellor Rachel Reeves, whose every speech tends to trigger a wave of pound sell-offs. Thus, while the pound's decline cannot be called unjustified, it also cannot be described as entirely natural.
Within a few hours, the Bank of England's meeting results will be announced. In my view, they could well turn out to be dovish, as the U.K. labor market is currently experiencing issues similar to those in the U.S. However, I still do not expect monetary policy easing. The MPC committee is unlikely to make a unanimous decision on rates, and the number of dovish policymakers will determine the pound's behavior throughout the day.
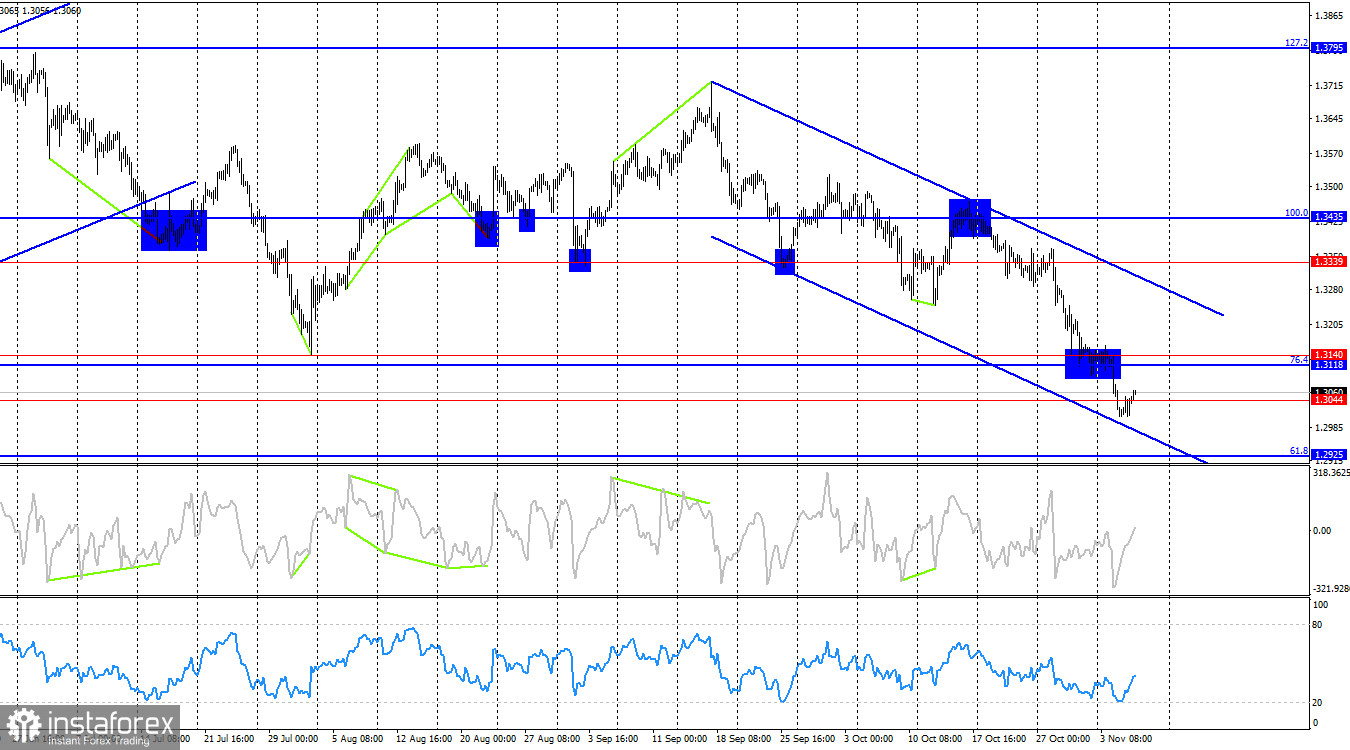
On the 4-hour chart, the pair has rebounded from the 100.0% Fibonacci correction level at 1.3435, which worked in favor of the U.S. currency, and consolidated below 1.3044. Thus, the downward movement may continue toward the next corrective level of 61.8% at 1.2925. No emerging divergences are visible on any indicators. The downward trend channel confirms a bearish trend that leaves little room for doubt.
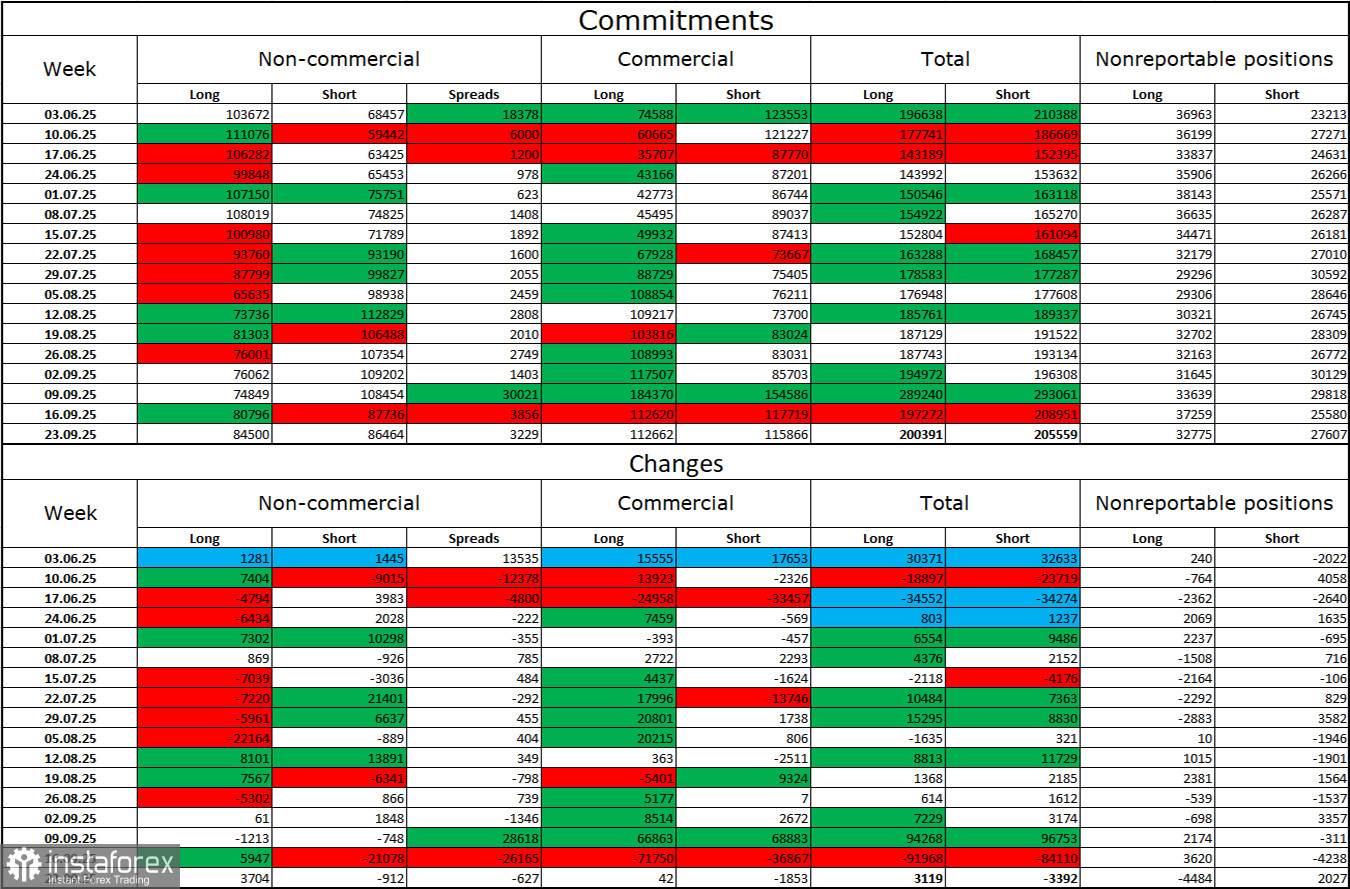
Commitments of Traders (COT) Report
The sentiment of the Non-commercial category of traders became more bullish during the last reported week — though that data is already a month old. The number of long positions held by speculators increased by 3,704, while short positions decreased by 912. The gap between long and short positions now stands at approximately 85,000 vs. 86,000. Bullish traders are once again tipping the balance slightly in their favor.
In my view, the pound still has downside potential, but with each passing month, the U.S. dollar appears increasingly weak. Previously, traders were worried about Donald Trump's protectionist policies, uncertain of their consequences; now, they are concerned about the results of those policies: a potential recession, the constant introduction of new tariffs, and Trump's conflict with the Federal Reserve, which could render the regulator politically compromised. In this context, the British pound looks far less risky than the U.S. dollar.
Economic Calendar for the U.S. and the U.K.:
- U.K. – Construction PMI (09:30 UTC)
- U.K. – MPC Monetary Policy Decision (12:00 UTC)
- U.K. – MPC Vote Results (12:00 UTC)
- U.K. – Bank of England's Accompanying Statement (12:00 UTC)
On November 6, the economic calendar includes four key releases, with all attention focused on the Bank of England meeting. The news background could have a significant impact on market sentiment throughout Thursday.
GBP/USD Forecast and Trading Advice:
Selling the pair was possible after closing below the 1.3354–1.3357 level on the hourly chart, with targets at 1.3313, 1.3247, and 1.3186 — all of which have been achieved with a margin. At the moment, I am not considering new short positions, as I believe the pound has already fallen enough recently. Buying opportunities appeared upon a rebound from the 1.3024 level on the hourly chart, with targets at 1.3110 and 1.3186.
Fibonacci grids are drawn from 1.3247–1.3470 on the hourly chart and from 1.3431–1.2104 on the 4-hour chart.