Analysis of Thursday's Trades
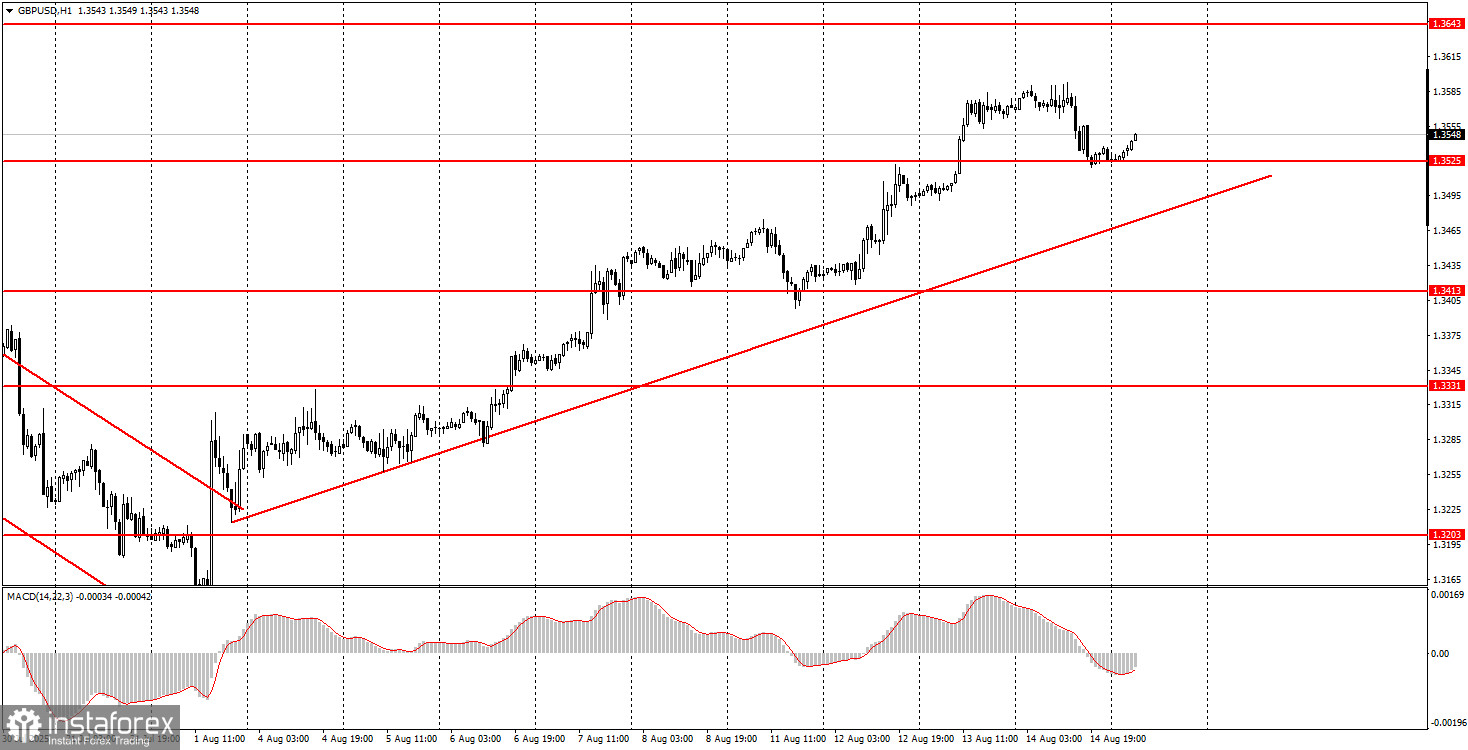
1H Chart of GBP/USD
The GBP/USD pair also corrected slightly lower on Thursday amid the high PPI reading. As we have already mentioned, even such a strong Producer Price Index value hardly changes market expectations for the Federal Reserve's monetary policy easing in September. The rate cut is almost guaranteed. This remains another bearish factor for the U.S. currency. However, the PPI calls into question further, more substantial rate cuts that Donald Trump, Scott Bessent, and "Republican" FOMC members had discussed. As long as Jerome Powell remains Fed Chair, there is little reason to expect large-scale easing. Rising inflation will force the Fed to balance between supporting the labor market and containing inflation. Thus, under current macroeconomic conditions, only two rate cuts should be expected before the end of the year. For the dollar, this is still bad news, as the Bank of England and the European Central Bank are unlikely to cut rates again before year-end.
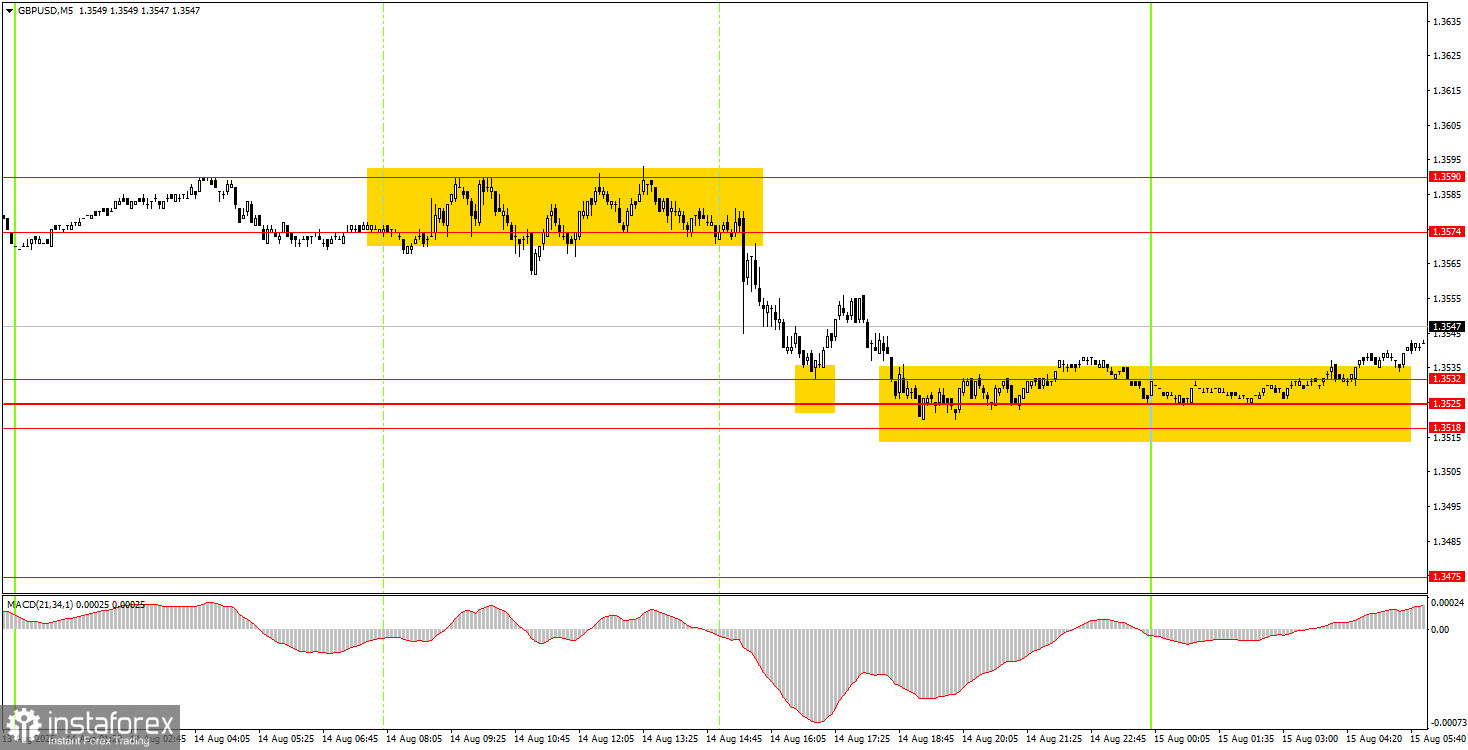
5M Chart of GBP/USD
In the 5-minute time frame on Thursday, only long signals were formed. Throughout the European trading session, the pair moved within the 1.3574–1.3590 range, but eventually rebounded from it, allowing for short entries. About an hour later, the price reached the 1.3518–1.3532 range, making it possible to close shorts and open longs. Long trades did not yield profit, but they also did not result in losses, as no sell signals were formed. By Friday morning, the price had bounced from the 1.3518–1.3532 area, so longs remain relevant.
Trading Strategy for Friday:
On the H1 chart, the GBP/USD pair indicates that the downtrend has ended. Given the events of the last two weeks, we would not bet even a penny on the growth of the U.S. currency. The dollar continues to decline steadily and consistently. The new ascending trendline supports the bulls, and there will be reasons to expect a decline only after the price consolidates below it.
On Friday, GBP/USD may well resume upward movement, as it failed to break through the 1.3518–1.3532 range. Thus, long positions targeting 1.3574–1.3590 and 1.3643 remain relevant. Short positions should be considered only after the ascending trendline on the H1 chart is broken.
On the M5 chart, trading can now be based on the levels: 1.3102–1.3107, 1.3203–1.3211, 1.3259, 1.3329–1.3331, 1.3413–1.3421, 1.3466–1.3475, 1.3518–1.3532, 1.3574–1.3590, 1.3643–1.3652, 1.3682, 1.3763. For Friday, no significant events are scheduled in the UK, while in the U.S., reports on industrial production, retail sales, and consumer sentiment will be published. Also, as a reminder, late in the evening, negotiations between Vladimir Putin and Donald Trump are expected, so volatility may spike sharply.
Core Trading System Rules:
- Signal Strength: The shorter the time it takes for a signal to form (a rebound or breakout), the stronger the signal.
- False Signals: If two or more trades near a level result in false signals, subsequent signals from that level should be ignored.
- Flat Markets: In flat conditions, pairs may generate many false signals or none at all. It's better to stop trading at the first signs of a flat market.
- Trading Hours: Open trades between the start of the European session and the middle of the US session, then manually close all trades.
- MACD Signals: On the hourly timeframe, trade MACD signals only during periods of good volatility and a clear trend confirmed by trendlines or trend channels.
- Close Levels: If two levels are too close (5–20 pips apart), treat them as a support or resistance zone.
- Stop Loss: Set a Stop Loss to breakeven after the price moves 20 pips in the desired direction.
Key Chart Elements:
Support and Resistance Levels: These are target levels for opening or closing positions and can also serve as points for placing Take Profit orders.
Red Lines: Channels or trendlines indicating the current trend and the preferred direction for trading.
MACD Indicator (14,22,3): A histogram and signal line used as a supplementary source of trading signals.
Important Events and Reports: Found in the economic calendar, these can heavily influence price movements. Exercise caution or exit the market during their release to avoid sharp reversals.
Forex trading beginners should remember that not every trade will be profitable. Developing a clear strategy and practicing proper money management are essential for long-term trading success.