Analysis of Tuesday's Trades
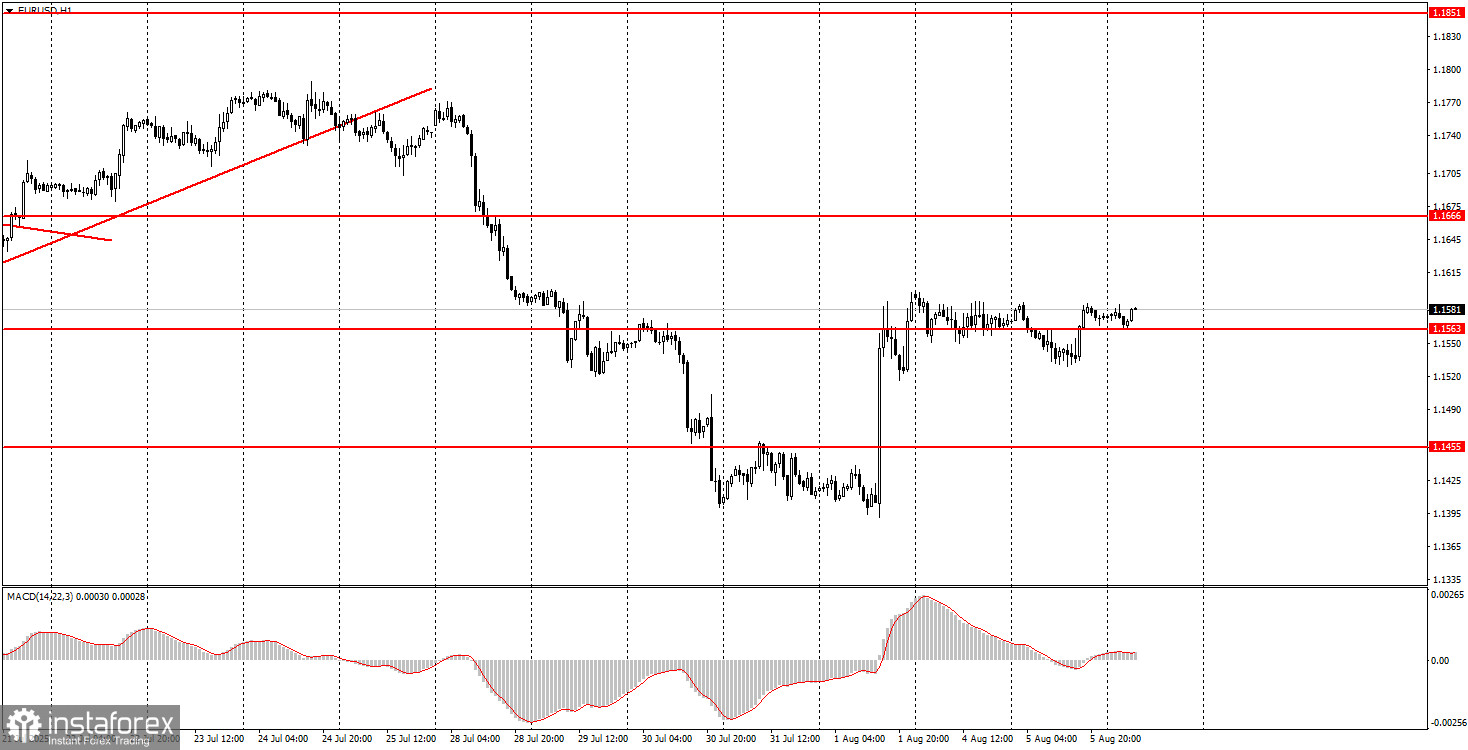
1H Chart of EUR/USD
On Tuesday, the EUR/USD currency pair continued to trade with minimal volatility and strictly sideways. Only one important report was released during the day — the ISM Services PMI in the U.S. As we expected, the report came in weaker than forecasts — 50.1 points in July. This leads us to two immediate conclusions. First, the services sector is also suffering from the trade war and Trump's policies. Second, the ISM Services Index risks dropping below the 50.0 "waterline" already in August. Taken together, we see a weakening labor market, rising unemployment, declines in both business activity indices, but at the same time, GDP growth. In our view, the macroeconomic data released in the U.S. in recent weeks point to a renewed decline in the dollar. As for the fundamental background, we won't dwell on it again. From our perspective, it remains extremely negative for the dollar.
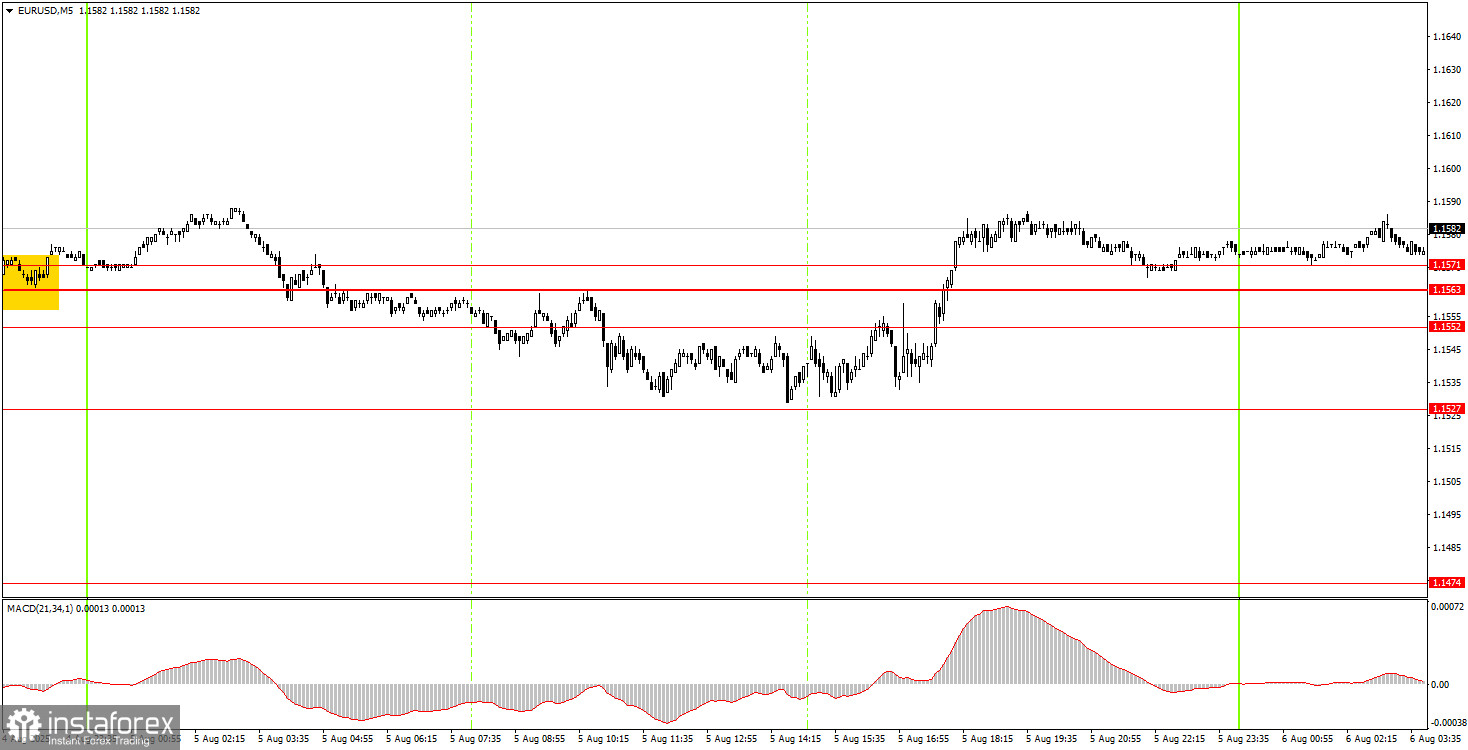
5M Chart of EUR/USD
On the 5-minute timeframe, there was movement on Tuesday only after the release of the ISM Services PMI. It was at that moment that the pair showed a noticeable upward move. Considering the nature of recent market behavior, there are four levels on the chart between which trading makes no sense. By the end of the day, the price had consolidated above all of these levels, so we still expect upward movement.
Trading Strategy for Wednesday:
On the hourly timeframe, the EUR/USD pair has every chance to resume the upward trend that has been forming since the beginning of the year. The U.S. dollar's "house of cards" has collapsed. We previously warned that the American currency lacked long-term growth drivers, and we also questioned the "optimism" surrounding Trump's policies and their initial results. Friday's events proved us right.
On Wednesday, the EUR/USD pair may resume its movement north. The market rested well on Monday and Tuesday, so it's now time to continue shedding the U.S. dollar. In addition to the disappointing labor market data, we can also highlight a new batch of tariffs from the generous American president — along with a fresh round of threats. As a support zone from which growth may begin, we recommend using the 1.1527–1.1571 range.
On the 5-minute timeframe, consider the following levels: 1.1198–1.1218, 1.1267–1.1292, 1.1354–1.1363, 1.1413, 1.1455–1.1474, 1.1527, 1.1552–1.1563–1.1571, 1.1655–1.1666, 1.1740–1.1745, 1.1808, 1.1851, 1.1908.
For Wednesday, the EU is scheduled to publish a retail sales report, while the U.S. event calendar is empty. Therefore, volatility may once again be low today.
Core Trading System Rules:
- Signal Strength: The shorter the time it takes for a signal to form (a rebound or breakout), the stronger the signal.
- False Signals: If two or more trades near a level result in false signals, subsequent signals from that level should be ignored.
- Flat Markets: In flat conditions, pairs may generate many false signals or none at all. It's better to stop trading at the first signs of a flat market.
- Trading Hours: Open trades between the start of the European session and the middle of the US session, then manually close all trades.
- MACD Signals: On the hourly timeframe, trade MACD signals only during periods of good volatility and a clear trend confirmed by trendlines or trend channels.
- Close Levels: If two levels are too close (5–20 pips apart), treat them as a support or resistance zone.
- Stop Loss: Set a Stop Loss to breakeven after the price moves 15 pips in the desired direction.
Key Chart Elements:
Support and Resistance Levels: These are target levels for opening or closing positions and can also serve as points for placing Take Profit orders.
Red Lines: Channels or trendlines indicating the current trend and the preferred direction for trading.
MACD Indicator (14,22,3): A histogram and signal line used as a supplementary source of trading signals.
Important Events and Reports: Found in the economic calendar, these can heavily influence price movements. Exercise caution or exit the market during their release to avoid sharp reversals.
Forex trading beginners should remember that not every trade will be profitable. Developing a clear strategy and practicing proper money management are essential for long-term trading success.