Trade Breakdown for Wednesday:
1H Chart of EUR/USD
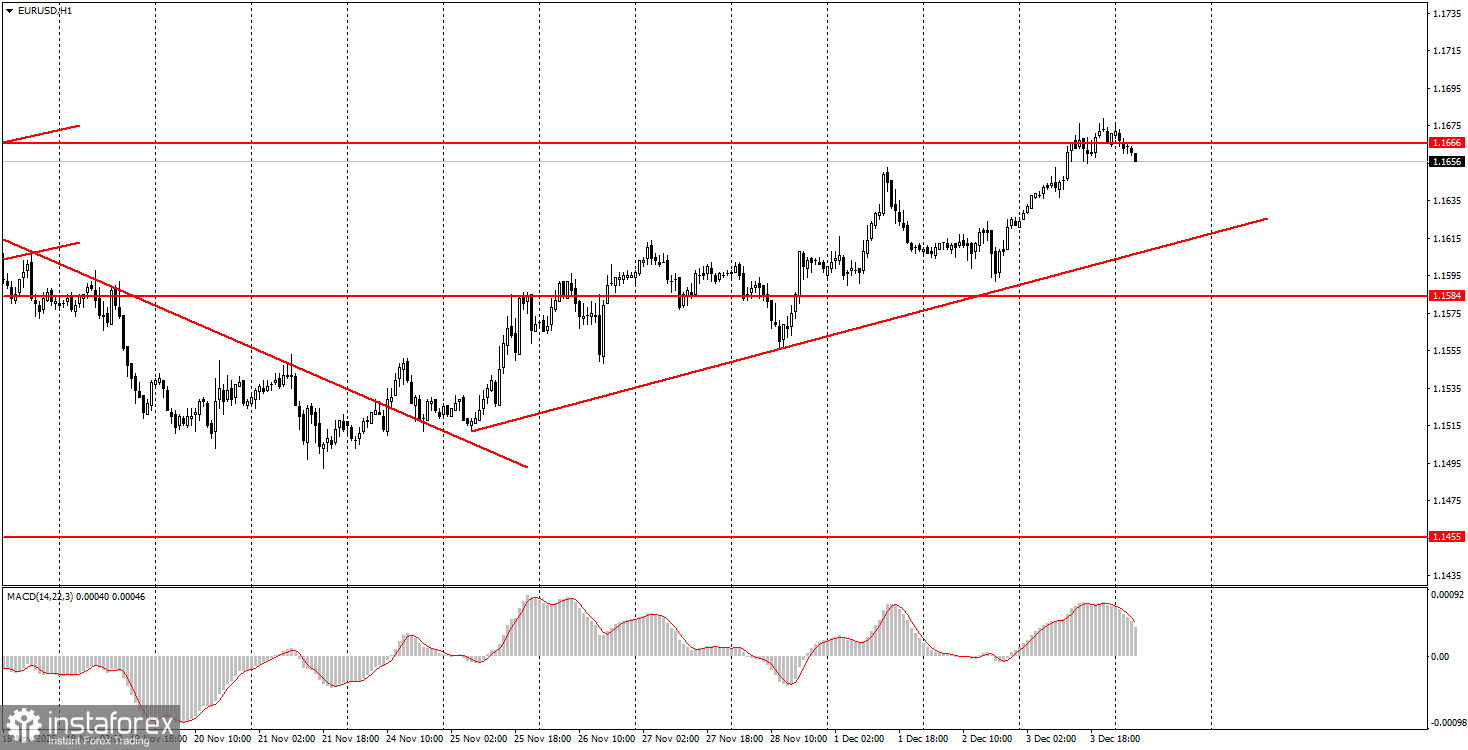
The EUR/USD currency pair resumed its upward movement on Wednesday after a slight pullback within the local upward trend. It is important to remember that a key technical point remains the flat on the daily timeframe between 1.1400 and 1.1830, which has persisted for five months. After the price reversal near the lower boundary of this sideways channel, a rise toward the upper boundary could be expected purely on technical grounds. Moreover, given that the dollar has not corrected properly against the euro over the past five months and given the fundamental background, any rise in the pair at this point is justified. Yesterday, the most significant macroeconomic data was published in the U.S., with the pivotal ADP report showing a disastrous figure of -32,000 jobs in the private sector. Other reports (ISM business activity index and industrial production) were slightly better; however, the Federal Reserve will hold its last meeting of the year on December 10, making the labor market data particularly significant. Reports on Non-Farm Payrolls and the unemployment rate will not be published before the Fed meeting, meaning the central bank will have to rely on the ADP report, which, as we can see, turned out poorly.
5M Chart of EUR/USD
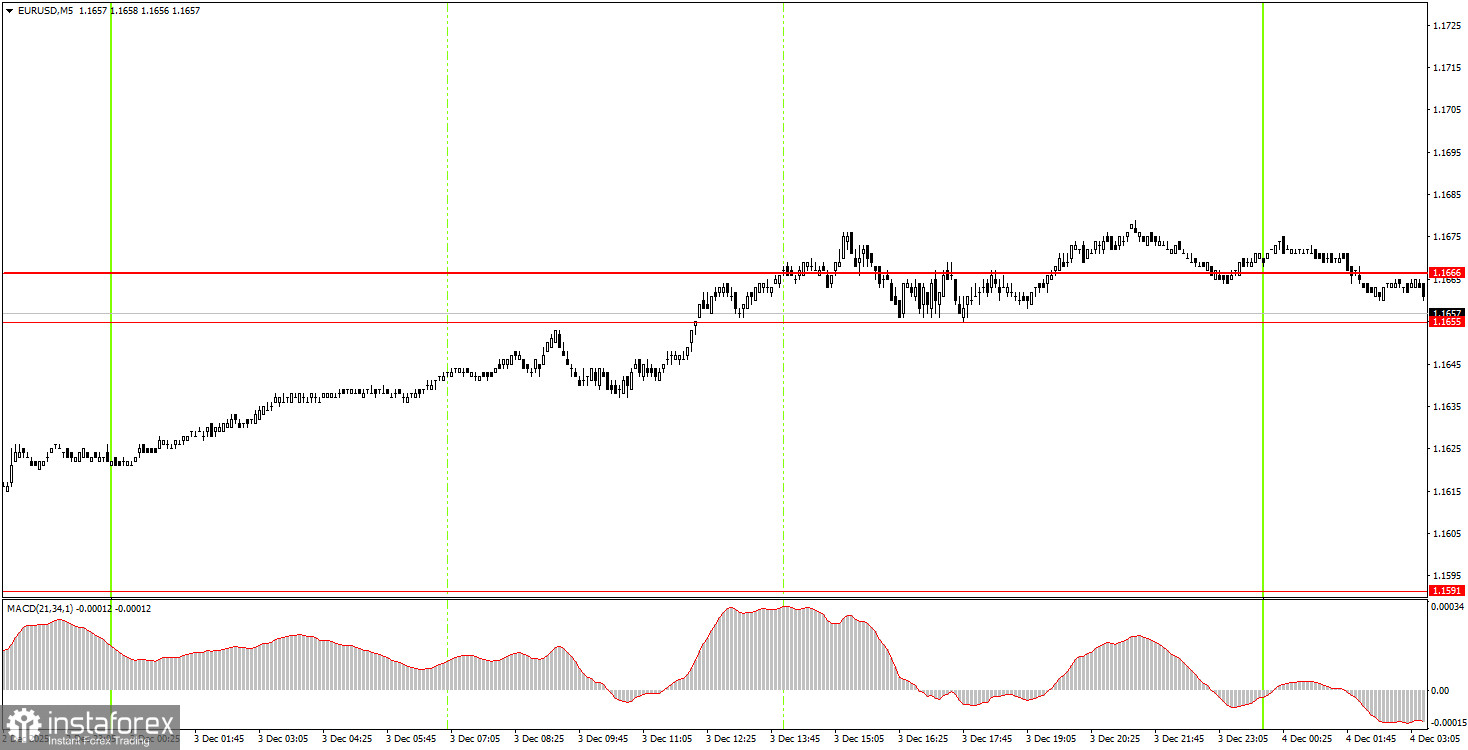
On the 5-minute timeframe, a single buy trading signal was formed during the day. The pair broke through the 1.1655-1.1666 range during the U.S. trading session, allowing beginner traders to open long positions. However, after breaking through the indicated area, the movement essentially stalled. Nonetheless, movement might continue today in the event of a rebound from this area.
How to Trade on Thursday:
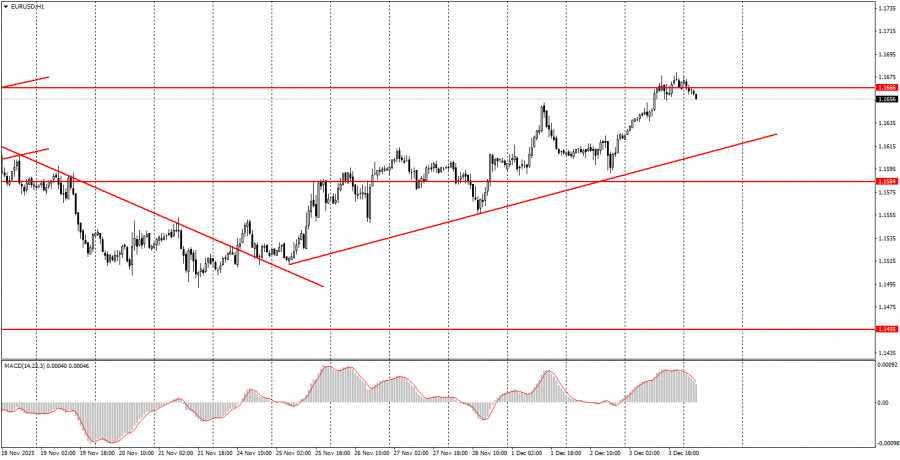
On the hourly timeframe, the EUR/USD pair continues to form an upward trend. The overall fundamental and macroeconomic background remains very weak for the U.S. dollar; therefore, we expect further growth. Even technical factors currently support the euro, as the flat on the daily timeframe persists, suggesting a reasonable expectation of growth toward the upper boundary after a price reversal around the lower boundary.
On Thursday, beginner traders may again look to trade from the area of 1.1655-1.1666. A bounce in price from this area will enable opening long positions, with targets set at 1.1745-1.1754. A consolidation below this area will indicate short positions with targets at 1.1584-1.1591.
On the 5-minute timeframe, the following levels should be considered: 1.1354-1.1363, 1.1413, 1.1455-1.1474, 1.1527-1.1531, 1.1571-1.1584, 1.1655-1.1666, 1.1745-1.1754, 1.1808, 1.1851, 1.1908, and 1.1970-1.1988. On Thursday, a retail sales report is planned for the Eurozone, while in the U.S., unemployment claims will be released. Both reports are secondary; hence, they are unlikely to provoke a strong market reaction. Today, beginner traders should pay more attention to technical factors.
Key Rules of the Trading System:
- The strength of a signal is determined by the time it takes to form the signal (bounce or breakout). The less time required, the stronger the signal.
- If two or more trades were opened near any level based on false signals, all subsequent signals from that level should be ignored.
- In a flat, any pair may form numerous false signals or none at all. At the first signs of a flat, it is better to stop trading.
- Trades are opened during the period between the beginning of the European session and the middle of the American session, after which all trades should be closed manually.
- On the hourly timeframe, it is preferred to trade only when there is good volatility and a trend confirmed by the trend line or channel, using signals from the MACD indicator.
- If two levels are too close to each other (5 to 20 pips), they should be viewed as a support or resistance area.
- Upon moving 15 pips in the right direction, set the Stop Loss to breakeven.
Chart Explanations:
- Support and Resistance Levels: Levels that serve as targets for opening buys or sells. Take Profit levels can be placed near them.
- Red Lines: Channels or trend lines that reflect the current trend and indicate the preferred direction for trading.
- MACD Indicator (14, 22, 3): A histogram and signal line; a supplementary indicator that can also be used as a source of signals.
Important Note: Significant speeches and reports (always included in the news calendar) can greatly influence the movement of the currency pair. Therefore, during their release, it is advisable to trade cautiously or exit the market to avoid sharp reversals against the preceding movement.
Remember: For beginners trading in the Forex market, it is important to understand that not every trade can be profitable. Developing a clear strategy and practicing money management are keys to long-term trading success.