empty
 
 
06.08.2025 06:01 AM
EUR/USD Forecast for August 6, 2025

Yesterday's U.S. business sentiment data for July came out mixed: Markit's Services PMI rose from 52.9 to 55.7, and the Composite Index increased from 52.9 to 55.1, while the ISM index weakened from 50.8 to 50.1. The euro neither rose nor fell by the end of the day, which allowed the media to interpret the more authoritative ISM data as weak. However, we would draw attention to even more important figures (from a pricing perspective): the trade balance and GDP forecast.

The trade deficit for June improved from –71.7 billion dollars to –60.2 billion, marking the best result in two years. Trump has managed to pull the U.S. out of a record trade deficit of –$ 138 billion over the last six months — the worst in history. If Trump's tariff policy continues at the same pace, the trade balance could turn positive as early as next year for the first time since 1982. Naturally, this would significantly strengthen the dollar. Also, the Atlanta Fed's GDP forecast for Q3 was raised from 2.1% to 2.5%.

Contrary to the narrative about capital flight from the U.S., we observe the opposite: inflows of foreign investments into U.S. securities in May totaled 318.5 billion dollars.

The U.S. balance of payments for Q1 is very poor — a deficit of 450.2 billion, also a record low. But for Q2, we expect a sharp improvement.

It seems that the current mixed and weak data, especially after Trump took control over the reporting, will increasingly be perceived by the market as informational noise. Major players will now focus more on the key factors affecting currency exchange rates: capital flows, inflation, government bond yields, and central bank balances. Added to this is the difference in economic growth rates between the U.S. and the Eurozone.

This image is no longer relevant

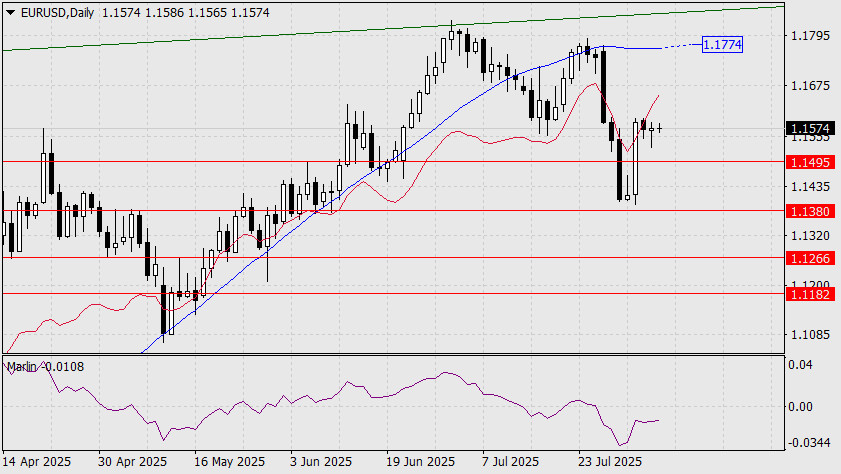
On the technical side, we see the euro consolidating for three days between the support level at 1.1495 and the balance indicator line. The Marlin oscillator's signal line is moving horizontally. The MACD line, which had started to turn downward, suddenly shifted into a sideways movement. All of these point to a potential upward move — but a fragile one.

If the price breaks below the 1.1495 support, it would open the way to 1.1380, followed by a decline to 1.1266. This remains our primary scenario.

This image is no longer relevant

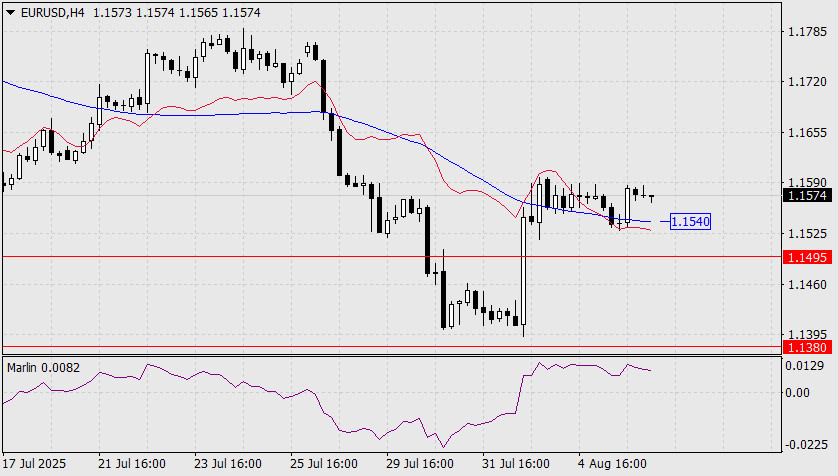
The first signal that the price has chosen a downward direction would be consolidation below the MACD line on the four-hour chart (1.1540). The Marlin oscillator is declining slightly ahead of the price and is gradually pulling it down. We are waiting for further developments.

The main scenario would likely only be invalidated if the price breaks above the MACD line on the daily chart (1.1774). Essentially, the 1.1495–1.1774 range is a zone of free wandering, primarily driven by news noise.

Laurie Bailey,
InstaForex के विश्लेषणात्मक विशेषज्ञ
© 2007-2025
Summary
Urgency
Analytic
Yuriy Zaycev
Start trade
Earn on cryptocurrency rate changes with InstaForex
Download MetaTrader 4 and open your first trade
  • Grand Choice
    Contest by
    InstaForex
    InstaForex always strives to help you
    fulfill your biggest dreams.
    कॉन्टेस्ट में हिस्सा लें
  • चैन्सी डिपॉजिट
    $ 3,000 के साथ अपना खाता जमा करें और प्राप्त करें $1000 अधिक!
    में अगस्त हम आकर्षित करते हैं $1000 चैंसी डिपॉज़िट में
    ट्रेडिंग अकाउंट में $ 3,000 जमा करके जीतने का अवसर प्राप्त करें इस शर्त को पूरा करके आप प्रतियोगिता में भाग ले सकते हैं
    कॉन्टेस्ट में हिस्सा लें
  • ट्रेड वाइज़, विन डिवाइस
    कम से कम $500 के साथ अपने खाते में टॉप अप करें, कॉन्टेस्ट के लिए साइन अप करें और मोबाइल डिवाइस जीतने का मौका पाएं।
    कॉन्टेस्ट में हिस्सा लें
  • 100% बोनस
    अपनी जमा राशि पर 100% बोनस प्राप्त करने का आपका अनूठा अवसर
    बोनस पायें
  • 55% बोनस
    अपनी प्रत्येक डिपॉजिट पर 55% बोनस के लिए आवेदन करें
    बोनस पायें
  • 30% बोनस
    हर बार खाता टॉप अप करने पर 30% बोनस प्राप्त करें
    बोनस पायें

अनुशंसित लेख

अभी बात नहीं कर सकते?
अपना प्रश्न पूछें बातचीत.
Widget callback