The GBP/USD currency pair continued its downward movement on Thursday, once again, without any clear fundamental basis. In previous articles, we've repeatedly pointed out the irrational nature of this ongoing trend. So, we won't repeat ourselves. If the euro currently has no strong reason to weaken, the pound has even fewer.
At least in the eurozone this week, there has been a political crisis in France (which still hasn't developed into anything), and Germany's industrial production report printed a disappointing result. In our view, even these events don't justify a sharp euro decline, as the fundamentals should be continuously assessed holistically, not selectively based on individual events or data while ignoring everything else. Nevertheless, these still qualify as "formal" reasons for downward pressure. The British pound, on the other hand, doesn't even have those.
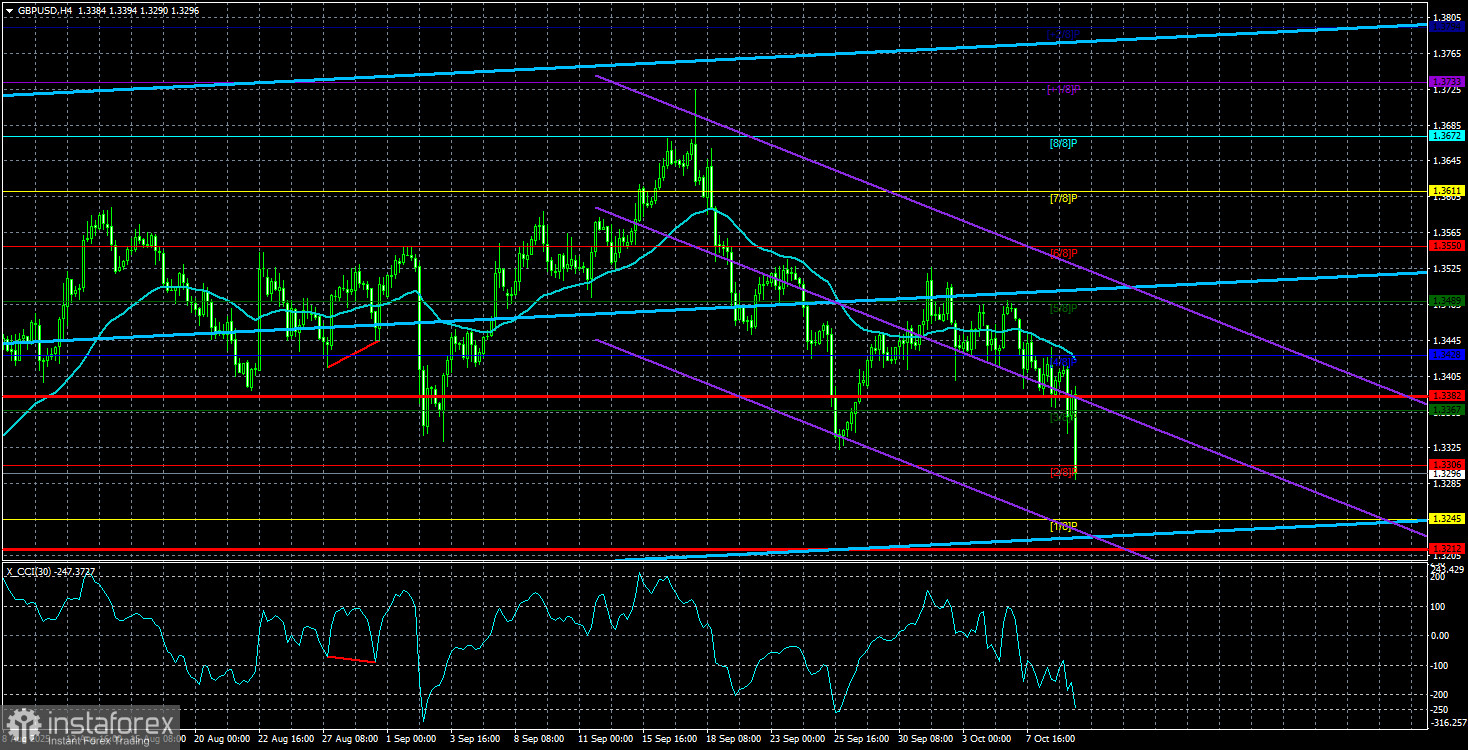
Once again, we encourage traders to take a look at the daily timeframe, where the broader picture is much clearer. On the 4H chart, we see an illogical decline in the pound at a time when it should be rising. However, the daily chart shows a flat market that has lasted several months, and such a sideways movement doesn't require fundamental justification.
Yesterday, GBP/USD returned to the area of its two most recent local lows, which is already a strong reason for the downtrend to potentially end here. Since markets are currently ignoring macroeconomic and fundamental factors, greater attention should be placed on technical analysis.
You can identify two sideways channels on the daily chart, with the most recent (narrower) one being between 1.3333 and 1.3664. Therefore, there is reason to believe that the price has tested the lower boundary of that range and may be preparing for another upward wave.
That said, predicting price behavior inside a flat market is challenging, as movements can be entirely disconnected from macroeconomic logic. Flats are periods when market makers are either accumulating or distributing positions. This often leads to irrational moves, as market makers follow their own internal strategies.
If they are distributing long positions, dollar strength may continue despite the broader economic picture. If they're accumulating long exposure, an upward breakout may eventually follow — a scenario that aligns better with the supportive macro and fundamental backdrop for the pound.
Thus, the best strategy at this point may be to wait for the emergence of a new local uptrend — one that remains part of the broader flat pattern. In this case, trading can resume in the direction of that trend, but traders should remain mindful of how the price behaves inside the broader channel.
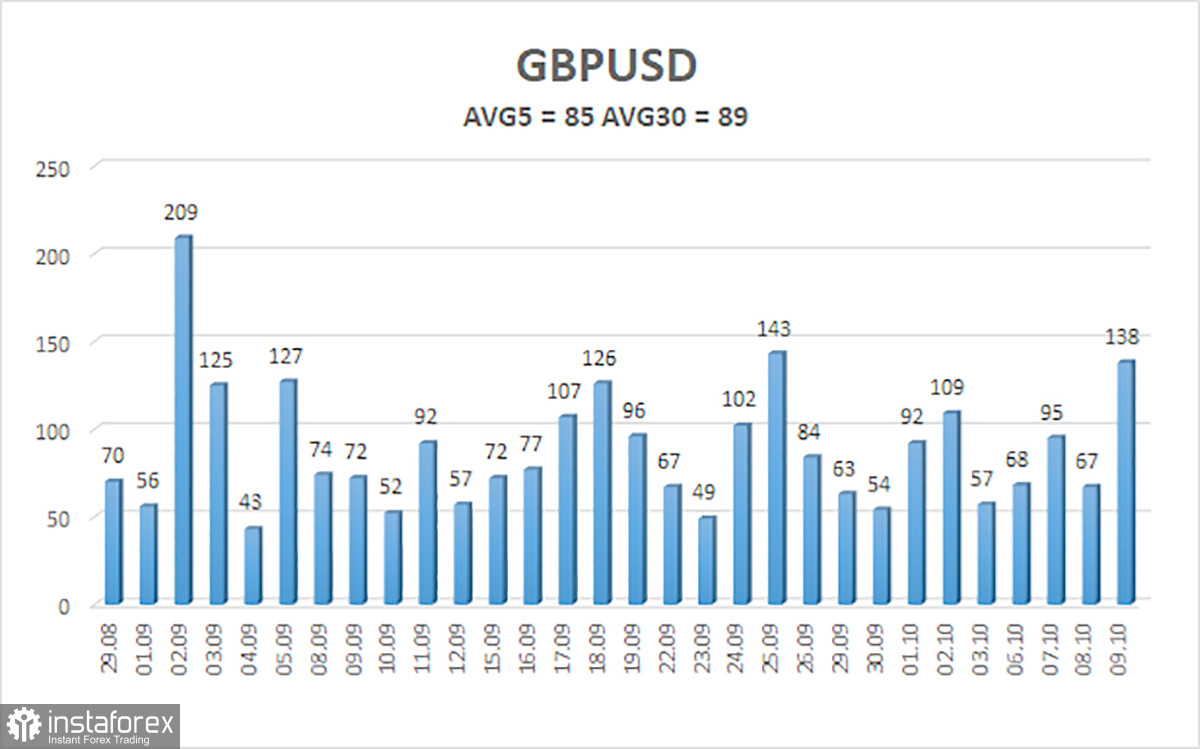
For example, this week the price has repeatedly bounced upward and reversed direction several times, while overall volatility remains relatively low.
The average volatility for GBP/USD over the last five trading days stands at 85 pips — considered "moderate" for this pair. For Friday, October 10, we expect movement within the range of 1.3212 to 1.3382. The longer-term linear regression channel is pointed upward, signaling that the overall trend remains bullish. The CCI indicator recently entered oversold territory, once again warning of a possible bullish reversal.
Nearest Support Levels:
- S1 – 1.3306
- S2 – 1.3245
- S3 – 1.3184
Nearest Resistance Levels:
- R1 – 1.3367
- R2 – 1.3428
- R3 – 1.3489
Trading Recommendations:
The GBP/USD pair is currently in a corrective phase, but its long-term outlook remains unchanged. Donald Trump's policies continue to exert pressure on the U.S. dollar, so we don't anticipate sustained dollar strength.
As a result, long positions with targets at 1.3672 and 1.3733 remain much more relevant when the price is above the moving average. If the price moves below the moving average, small short positions targeting 1.3245 and 1.3212 can be considered solely on technical grounds.
From time to time, the dollar shows signs of strength (as it does now), but any trend change would require real signs of progress — like an end to the trade war or other globally positive developments.
Chart Notes:
- Linear Regression Channels help define the current trend. If both channels are sloping in the same direction, the trend is strong.
- The Moving Average (setting 20.0, smoothed) indicates short-term direction.
- Murrey Math Levels (support/resistance lines) are used for key movement/correction levels.
- Volatility Levels (red lines) represent the probable price range for the day based on current volatility metrics.
- CCI Indicator – if CCI moves below -250 (oversold) or above +250 (overbought), a trend reversal may be nearing.