The GBP/USD currency pair continued its decline on Monday and extended the move into Tuesday. It's worth noting that the British pound began falling earlier than the euro, already last week. At the time, we questioned the validity of this movement, considering it to be a technical correction. We still hold that view. Even the euro is showing signs of correction, and the technical factor is playing a significant role. The issue is that both currency pairs have been rising for six consecutive months with almost no pullbacks. We have nothing against the dollar continuing to weaken for another 16 years, but corrections are still necessary. The longer they are delayed, the higher the probability they will begin soon.
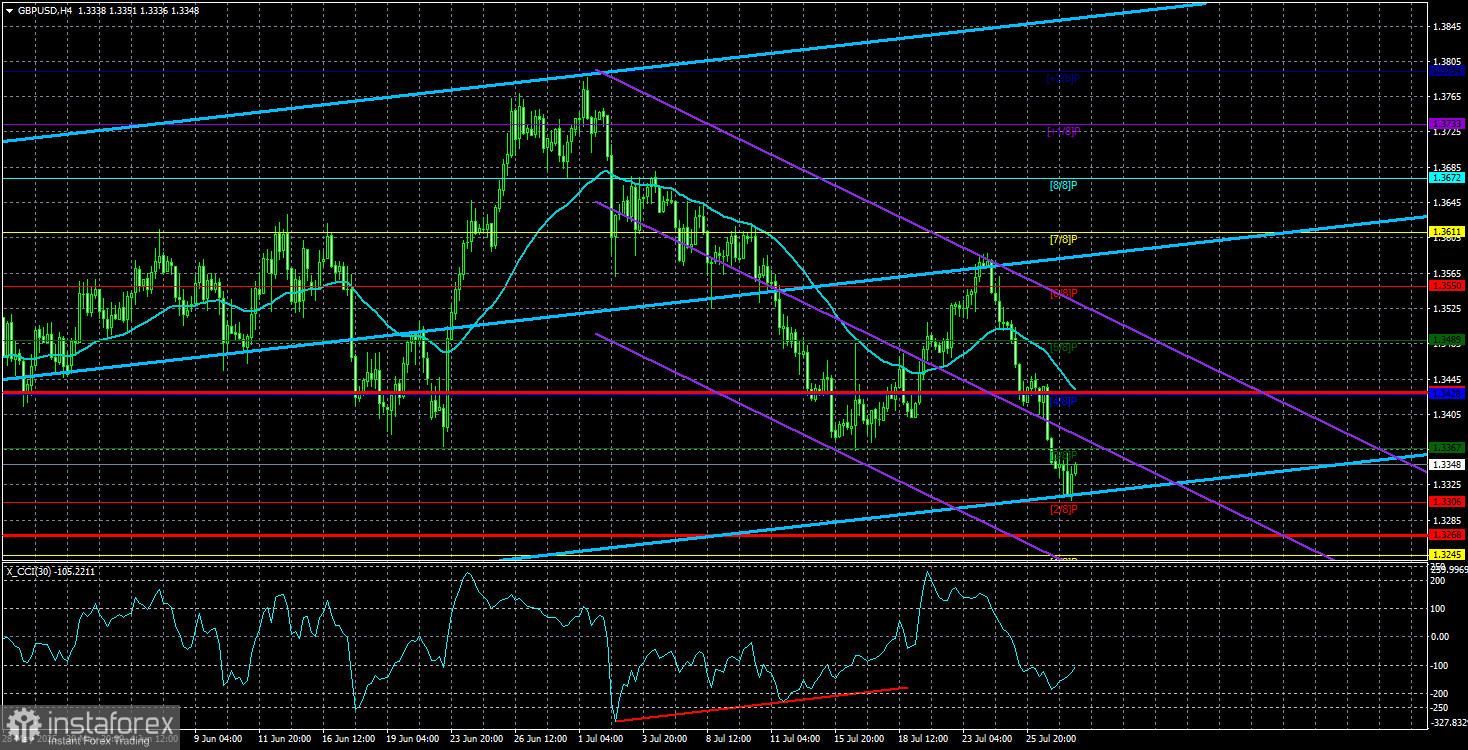
It took six months of waiting, but now the British pound is falling just as fast as it had been rising over the past half-year—despite lacking strong reasons. Unlike the euro, the pound has already worked through the 23.6% Fibonacci retracement level on the daily timeframe and has confidently broken below it. As such, the correction could continue toward the Senkou Span B line on the daily chart, which nearly coincides with the 38.2% Fibonacci level. Based on the EU–U.S. trade deal alone, we're unlikely to see the dollar return to its January 2025 levels, but it could very well rise for another couple of weeks.
The trade deal between the EU and the U.S. has no direct relation to the British pound. So why is the pound falling even faster and more confidently than the euro? Because of correction, correlation, and because "you can't always win." While the pound was rising amid global dollar weakness, we frequently pointed out that the pound itself had no real grounds for growth. It was rising solely because the dollar was falling. There was no fundamental support for the pound's strengthening.
Consider this: the Bank of England cut rates twice in 2025, while the Federal Reserve didn't cut them at all. The British economy remains sluggish. Inflation in the UK is rising. Unemployment is also increasing. The trade deal between London and Washington is also primarily favorable to the U.S., not to the UK. But until recently, the market focused only on the global trade war that Donald Trump continues to escalate. Now, however, the time has come for a correction—and the EU has signed the worst deal imaginable from the market's perspective. That said, we repeat: the deal between the EU and the U.S. is likely the most favorable one Europe could realistically get from Trump. It's just that Europe expected something far better.
There are still three days left in this trading week, and tonight the results of the Federal Reserve meeting will be released. Even though the Fed is 100% expected to leave the key rate unchanged, the market is in a highly emotional state. A single misstep or ambiguous gesture from Powell could send the dollar plunging again—or, conversely, spark continued growth. Let's recall that markets are expecting the Fed to implement strong monetary easing, and Trump's victory over the EU could lead investors to believe he will also defeat Powell.
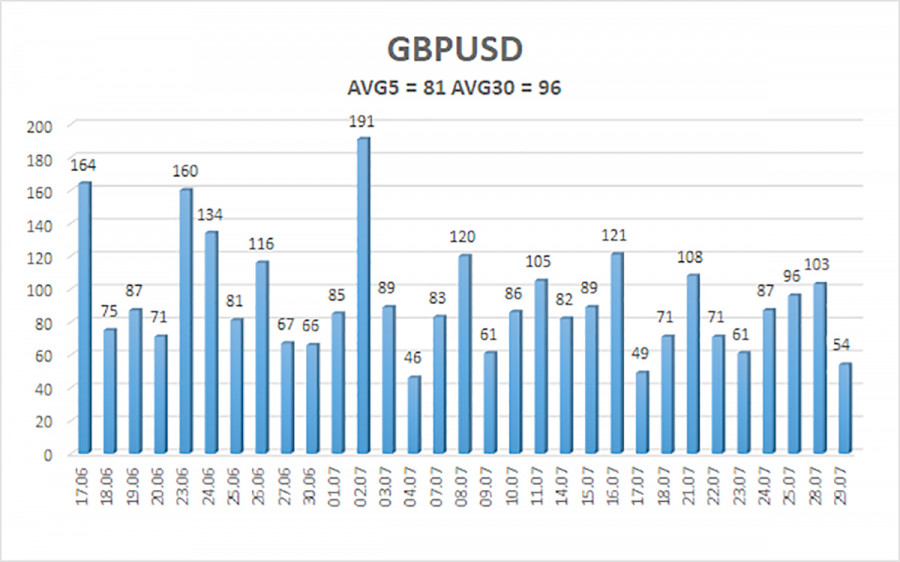
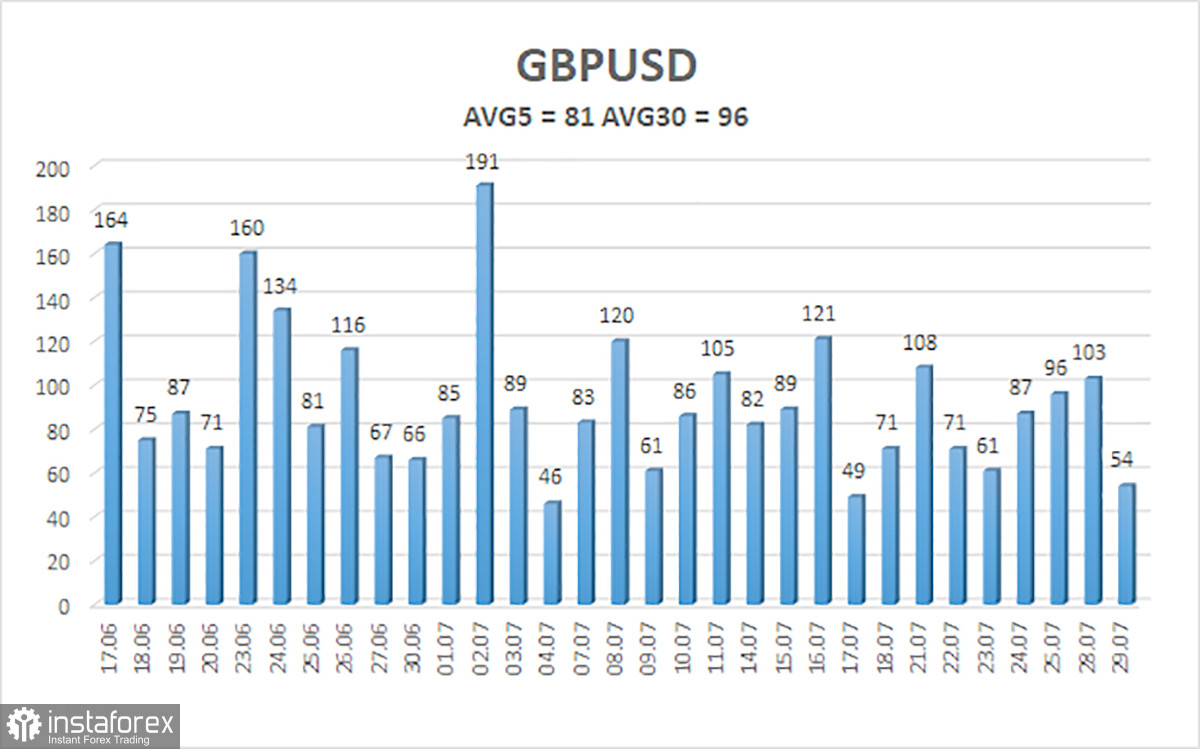
The average volatility of the GBP/USD pair over the past five trading days is 81 pips, which is considered "moderate" for this currency pair. On Wednesday, July 30, we expect movement within the range defined by 1.3268 and 1.3430. The long-term linear regression channel is pointing upward, indicating a clear long-term uptrend. The CCI indicator has entered oversold territory twice, signaling a potential resumption of the upward trend. A new corrective leg has now begun.
Nearest Support Levels:
S1 – 1.3306
S2 – 1.3245
S3 – 1.3184
Nearest Resistance Levels:
R1 – 1.3367
R2 – 1.3428
R3 – 1.3489
Trading Recommendations:
The GBP/USD pair has resumed its downward technical correction. In the medium term, Trump's policies will likely continue to pressure the U.S. dollar. Therefore, long positions targeting 1.3550 and 1.3611 remain relevant as long as the price stays above the moving average.
If the price falls below the moving average, short positions can be considered with a target at 1.3268, based purely on technical grounds. From time to time, the dollar shows corrective strength, but for it to regain a sustainable bullish trend, there must be real signs of an end to the global trade war, which now seems increasingly unlikely.
Explanation of Illustrations:
Linear Regression Channels help determine the current trend. If both channels are aligned, it indicates a strong trend.
Moving Average Line (settings: 20,0, smoothed) defines the short-term trend and guides the trading direction.
Murray Levels act as target levels for movements and corrections.
Volatility Levels (red lines) represent the likely price range for the pair over the next 24 hours based on current volatility readings.
CCI Indicator: If it enters the oversold region (below -250) or overbought region (above +250), it signals an impending trend reversal in the opposite direction.