Analysis of Friday's Trades
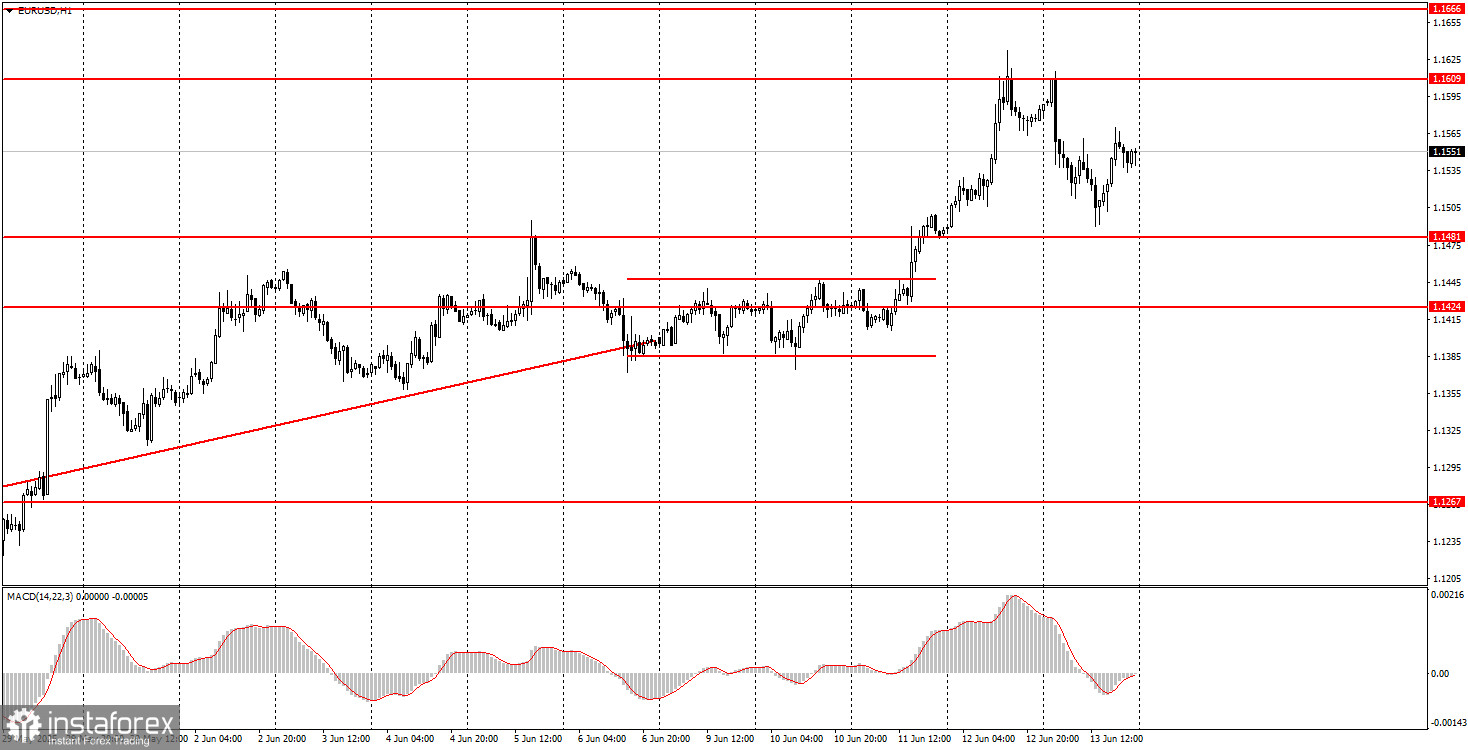
1H Chart of EUR/USD
On Friday night, the EUR/USD currency pair experienced a sharp drop, followed by a recovery throughout the rest of the day. Thus, the entire day can be divided into two parts. Initially, the dollar strengthened confidently (something that has become extremely rare lately), and then the market came to its senses and realized what had happened. The market's initial reaction to Israel's powerful strike on Iran was quite natural—but not for today's conditions. In the past, the dollar would always appreciate when geopolitical tensions rose globally. Now, completely different factors are in play, and the dollar can no longer be considered a "safe haven" currency. That's why the market, driven by emotions, initially bought the dollar and quickly reversed it back to where it belongs—as long as Donald Trump remains President of the United States.
Interestingly, Trump immediately denied any involvement in the attack on Iran while at the same time stating that Tehran had not agreed to a nuclear deal but still had a chance to do so. Therefore, we are at the beginning of a new conflict initiated by Trump-the-Peacemaker—this time with Iran.
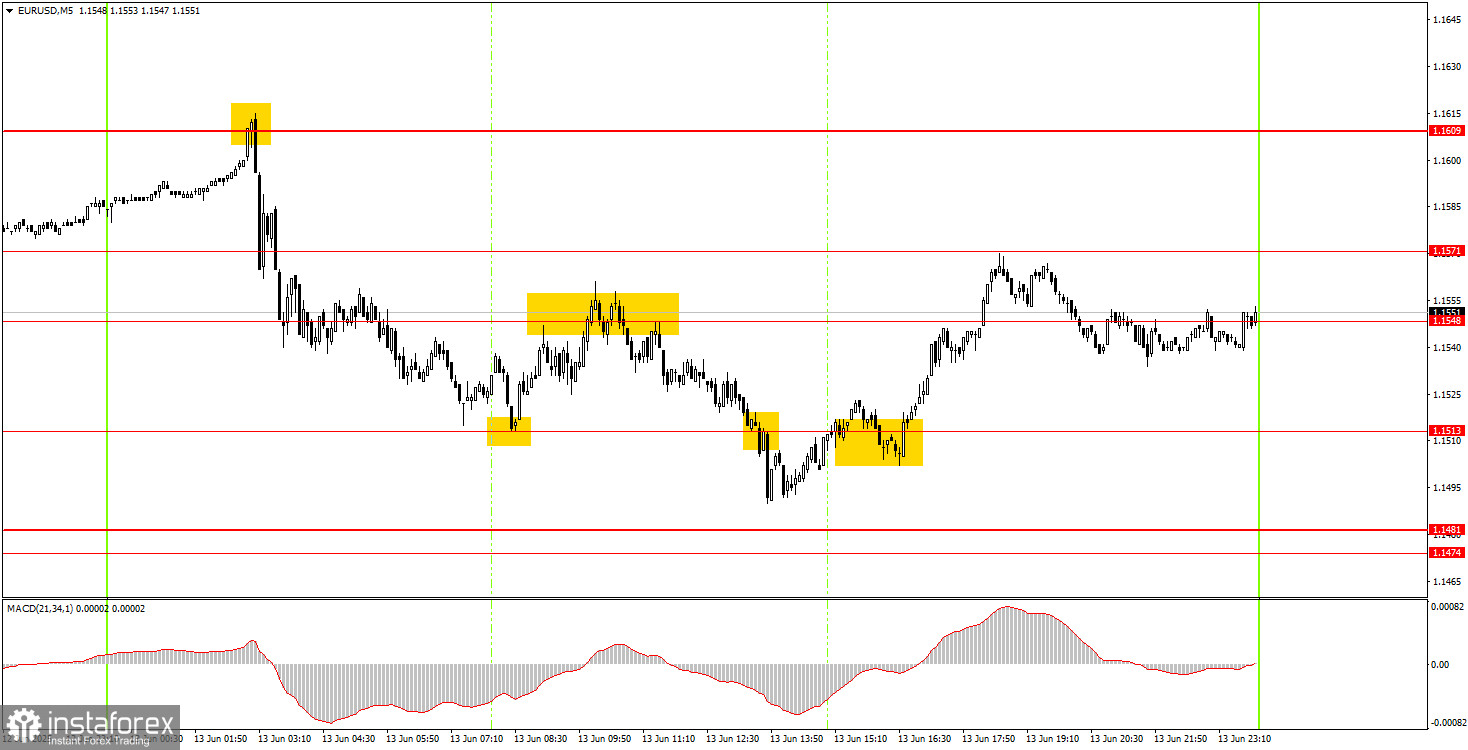
5M Chart of EUR/USD
On the 5-minute timeframe, several trading signals were formed on Friday, but the intraday movements were not particularly favorable. There was little macroeconomic data; by then, the market had already calmed down after the night's events. Four trading signals were generated during the day, each allowing for gains of around 15–20 pips. No false signals appeared though the precision of some was not ideal.
Trading Strategy for Monday:
On the hourly timeframe, the EUR/USD pair continues its upward trend, which began under Trump and, it seems, will not end while he remains in office. In essence, the fact that Trump is President of the United States is still sufficient for the regular weakening of the U.S. dollar. Even the escalation of the conflict between Iran and Israel has not affected the overall state of the American currency—because of Trump. The U.S. leader continues to issue threats, make ultimatums, impose or raise tariffs, and enact other high-profile measures. Therefore, even if the market doesn't sell the dollar daily, it certainly has no intention of buying it for the medium term.
Predicting the movement of the dollar on Monday is highly challenging. Over the weekend, Iran has already carried out a retaliatory strike on Israel, and what else might happen before Monday morning is hard to imagine.
In the 5-minute timeframe, consider the following levels: 1.1132–1.1140, 1.1198–1.1218, 1.1267–1.1292, 1.1354–1.1363, 1.1413–1.1424, 1.1474–1.1481, 1.1513, 1.1548, 1.1571, 1.1609, 1.1666, 1.1704, 1.1802. On Monday, there will be no macroeconomic background, and the market will respond to the weekend developments between Israel and Iran and any new statements from Trump if any occur.
Core Trading System Rules:
- Signal Strength: The shorter the time it takes for a signal to form (a rebound or breakout), the stronger the signal.
- False Signals: If two or more trades near a level result in false signals, subsequent signals from that level should be ignored.
- Flat Markets: In flat conditions, pairs may generate many false signals or none at all. It's better to stop trading at the first signs of a flat market.
- Trading Hours: Open trades between the start of the European session and the middle of the US session, then manually close all trades.
- MACD Signals: On the hourly timeframe, trade MACD signals only during periods of good volatility and a clear trend confirmed by trendlines or trend channels.
- Close Levels: If two levels are too close (5–20 pips apart), treat them as a support or resistance zone.
- Stop Loss: Set a Stop Loss to breakeven after the price moves 15 pips in the desired direction.
Key Chart Elements:
Support and Resistance Levels: These are target levels for opening or closing positions and can also serve as points for placing Take Profit orders.
Red Lines: Channels or trendlines indicating the current trend and the preferred direction for trading.
MACD Indicator (14,22,3): A histogram and signal line used as a supplementary source of trading signals.
Important Events and Reports: Found in the economic calendar, these can heavily influence price movements. Exercise caution or exit the market during their release to avoid sharp reversals.
Forex trading beginners should remember that not every trade will be profitable. Developing a clear strategy and practicing proper money management are essential for long-term trading success.