The EUR/USD pair continued to trade on Tuesday in precisely the same manner as it had for the past two and a half weeks. However, shortly before noon, something inexplicable happened. The US dollar began to appreciate sharply, and the EUR/USD pair plunged downward like a stone—something that hadn't occurred in nearly 7 or 8 months, ever since Donald Trump became president of the United States for the second time.
All we can do is speculate about what exactly happened in the currency market and what major players were reacting to. The only hypothesis might be the eurozone inflation report. Although the decline began an hour before its publication, such a turn of events does not surprise us at all. That's what market makers are for—they have access to insider information. Of course, maybe they don't always get macroeconomic data before other market participants, but yesterday was probably not one of those times.
So, the Consumer Price Index in the eurozone for August accelerated to a "whole" 2.1% year-over-year. Recall that we warned about possible inflation growth based on the German inflation report, which also exceeded forecasts. But, of course, we couldn't have predicted such a sharp reaction from the market. And even after the inflation report became available to all players, it's hard to say precisely what the market reacted to.
Yes, EU inflation rose, but only by a minimal amount and, in any case, remains close to the ECB's target level. Yes, inflation accelerated, so the ECB is unlikely to ease monetary policy in the near future. Wait—if this is the case, the euro should have received market support, not come under heavy fire. In other words, rising inflation is a reason for the market to buy euros, not to sell them, because ECB policy now doesn't foresee new easing.
In conclusion, if the inflation report was indeed the reason for the collapse of the European currency, then there was no logic or pattern to such a movement. It is possible that we just witnessed another manipulation by large players. After the "lunch collapse," the EUR/USD pair remained within the sideways channel that we have been repeatedly discussing lately.
So, essentially, we saw a sharp drop within the flat. If this movement isn't connected to any global events (of which nothing is known so far), then it was just a downward leg within the sideways channel. Nothing more.
Thus, at the current moment, we can say one thing—the flat continues. How much longer it will last depends only on the macroeconomic background this week. We fully allow for volatility to rise, but the flat itself may not end. So technically, nothing extraordinary happened yesterday.
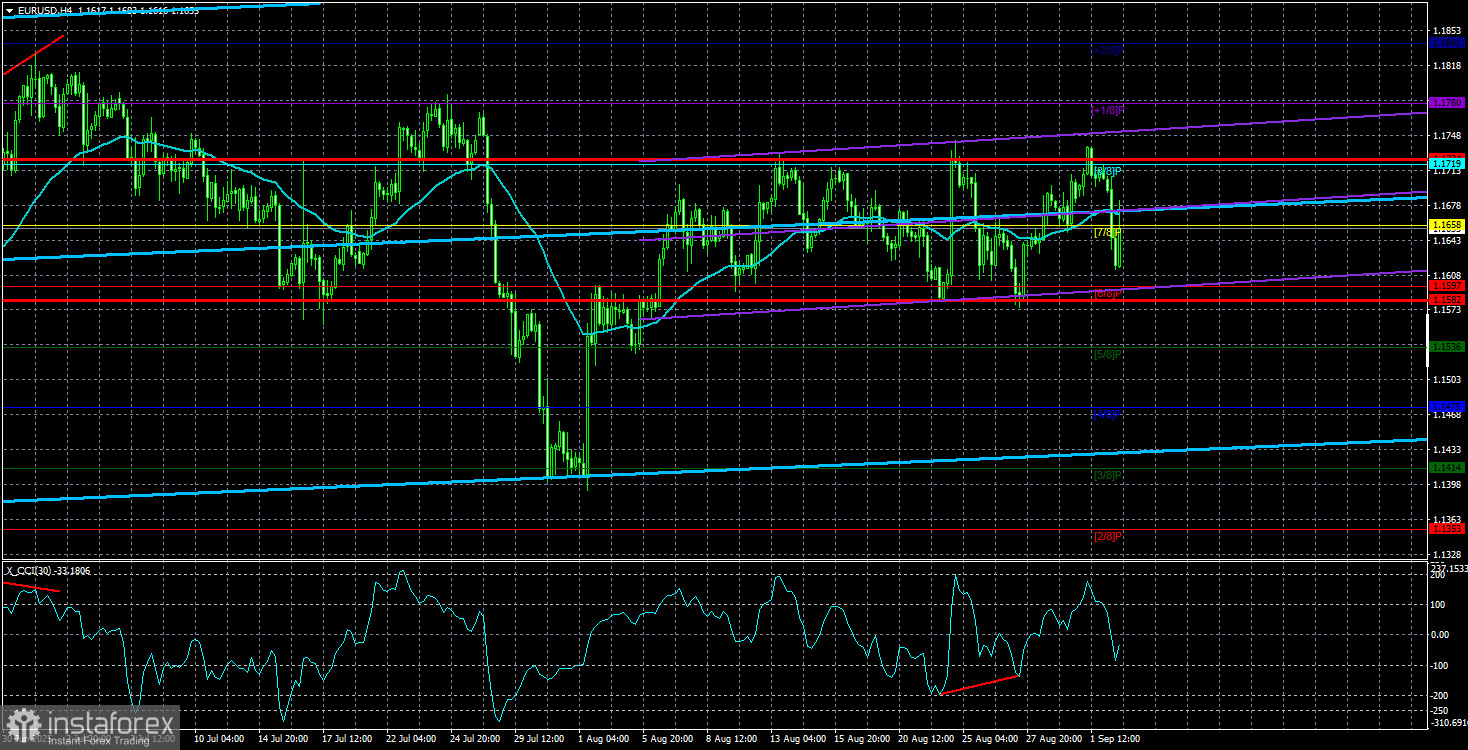
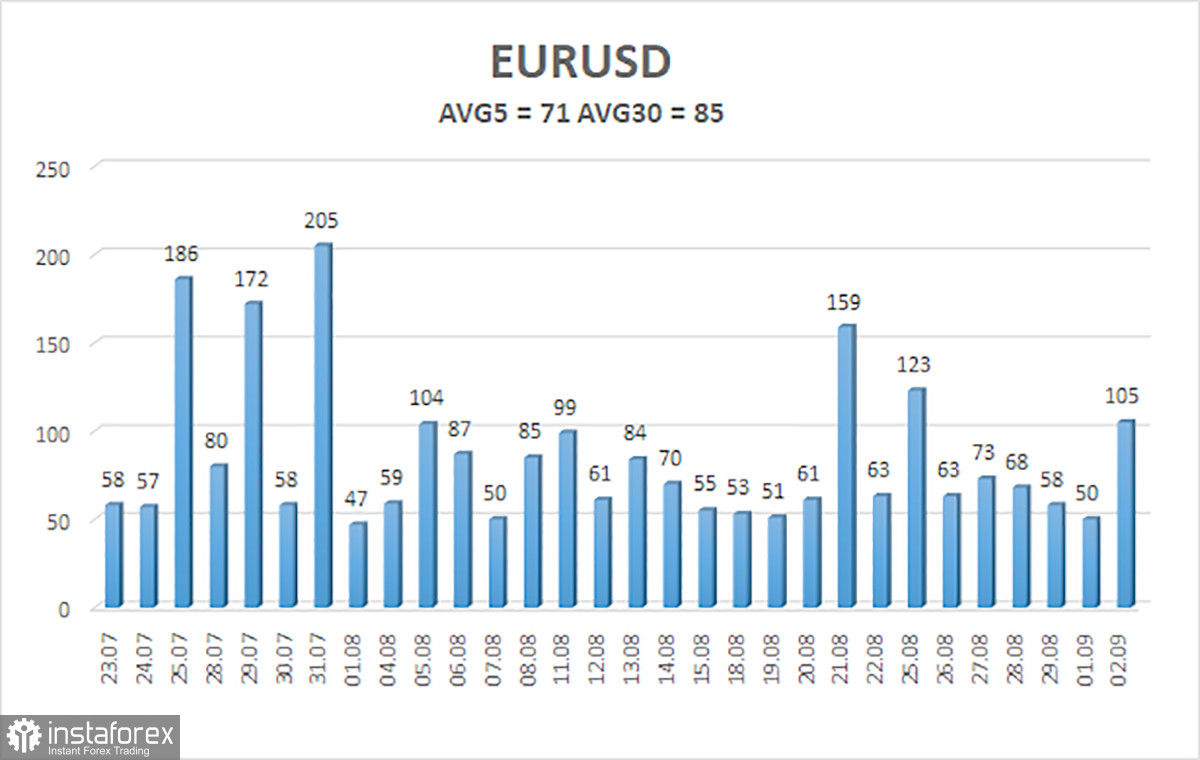
The average volatility of EUR/USD over the last five trading days as of September 3 is 71 pips, which is considered "average." We expect the pair to move between the levels of 1.1582 and 1.1724 on Wednesday. The linear regression channel's upper band is directed upward, which still indicates an uptrend. The CCI indicator has entered the oversold area three times, warning of a resumption of the uptrend. A new bullish divergence has formed, warning of further growth.
Nearest Support Levels:
S1 — 1.1597
S2 — 1.1536
S3 — 1.1475
Nearest Resistance Levels:
R1 — 1.1658
R2 — 1.1719
R3 — 1.1780
Trading Recommendations:
The EUR/USD pair may resume its uptrend. The US dollar is still experiencing strong pressure from Trump's policy, as he's not intending to "stop at what has been achieved." The dollar has risen as much as it could, but now it seems to be time for another round of prolonged decline. If the price is below the moving average, small shorts may be considered with targets at 1.1597 and 1.1582. Above the moving average, long positions remain relevant, with targets at 1.1761 and 1.1780 in continuation of the trend. Currently, the market remains in a flat with approximate boundaries at the Murrey levels of 1.1597 and 1.1719.
Chart Elements Explained:
- Linear regression channels help determine the current trend. If both channels point in the same direction, the trend is strong.
- The moving average line (settings 20,0, smoothed) indicates the short-term trend and trade direction.
- Murray levels serve as target levels for moves and corrections.
- Volatility levels (red lines) are the likely price channel for the next day, based on current volatility readings.
- The CCI indicator: dips below -250 (oversold) or rises above +250 (overbought) mean a trend reversal may be near.