On Tuesday, the GBP/USD currency pair spent most of the day moving sideways. This is not surprising, as there were no significant events in at least the first half of the day. In the second half, the important and widely discussed U.S. ISM Services PMI was published, but it's still just one report over the entire day.
What surprises us is that the market essentially ignored two major developments, both involving Donald Trump once again. First, Trump dismissed the head of the Bureau of Statistics, Erica McEntarfer, making it clear that he would not mind gaining control over statistical information. Then, "coincidentally," FOMC member Adriana Kugler resigned. Naturally, Trump will quickly appoint a replacement—one who will vote at Federal Reserve meetings in line with the president's preferences. As a result, Trump now has three "permanent doves" within the monetary policy committee.
This leads to the following conclusion: over the next year, the Bureau of Statistics could fall completely under Trump's control. The Fed could also become entirely influenced by Trump—not legally, but through a composition that votes however he wants. Thus, the two largest independent institutions may simply start following top-down orders. How can there be any trust in such institutions under those conditions?
Let's return to more immediate concerns. This Thursday, the Bank of England will hold its next meeting for 2025, where a 0.25% rate cut is possible. Forecasts for the key rate are rarely wrong, as central banks usually begin signaling their decisions well before they are officially announced. The rhetoric shifts, allowing markets to infer what the central bank is preparing to do.
This time, however, the situation is more unclear, as neither Andrew Bailey nor his colleagues have made any recent statements hinting at a rate cut in August. On the contrary, just last month Bailey questioned the need for further monetary policy easing and earlier this year predicted rising inflation multiple times. Therefore, we are somewhat surprised by the official forecasts suggesting a rate cut. If there were more information about the basis for these projections, they might be easier to understand.
As such, we doubt that the BOE will lower the key rate this Thursday. It could happen, but in that case, the vote within the Monetary Policy Committee would likely be very close—say, 5 to 4. How would such a decision be interpreted? We believe it would have little impact on overall market sentiment. The pound may drop temporarily, but in the long term, it is likely to continue rising due to much broader factors linked to Trump and his policies.
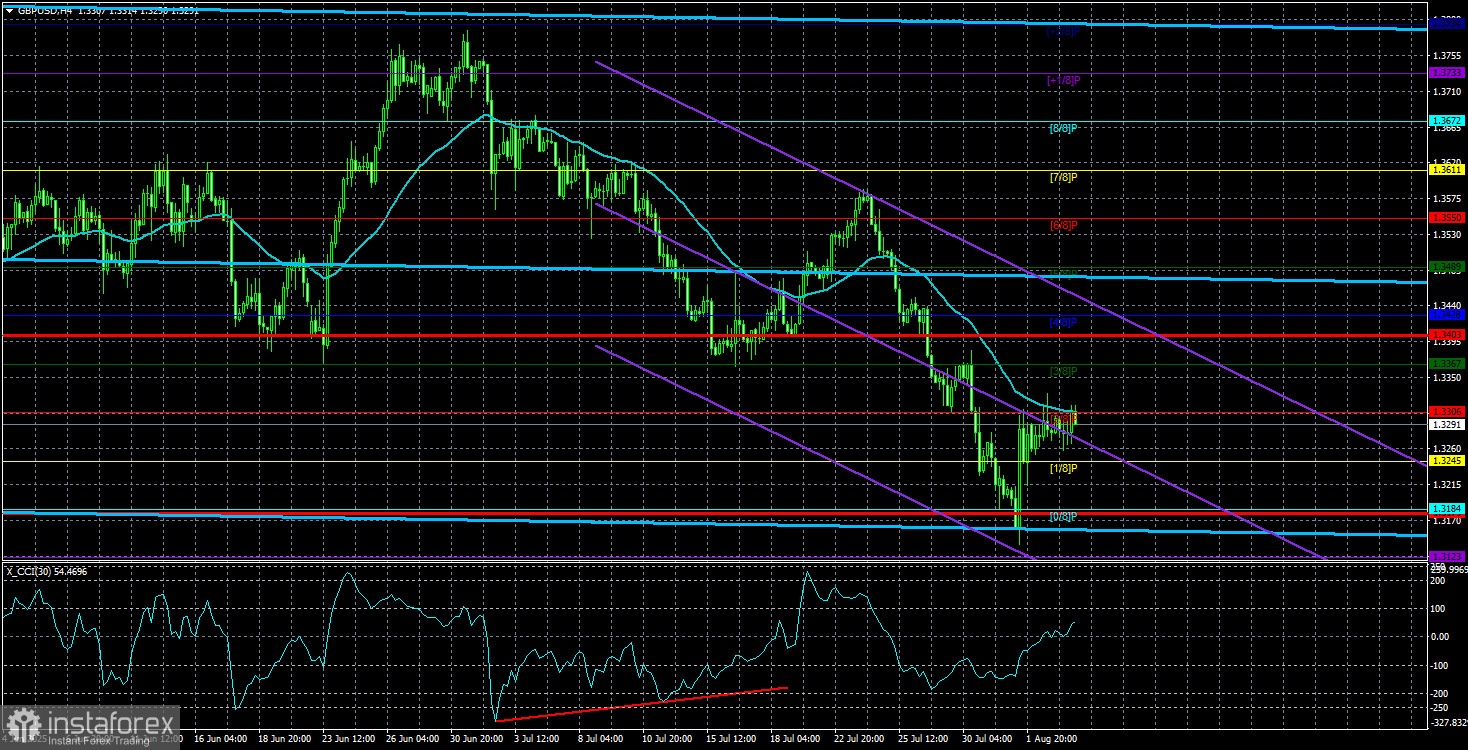
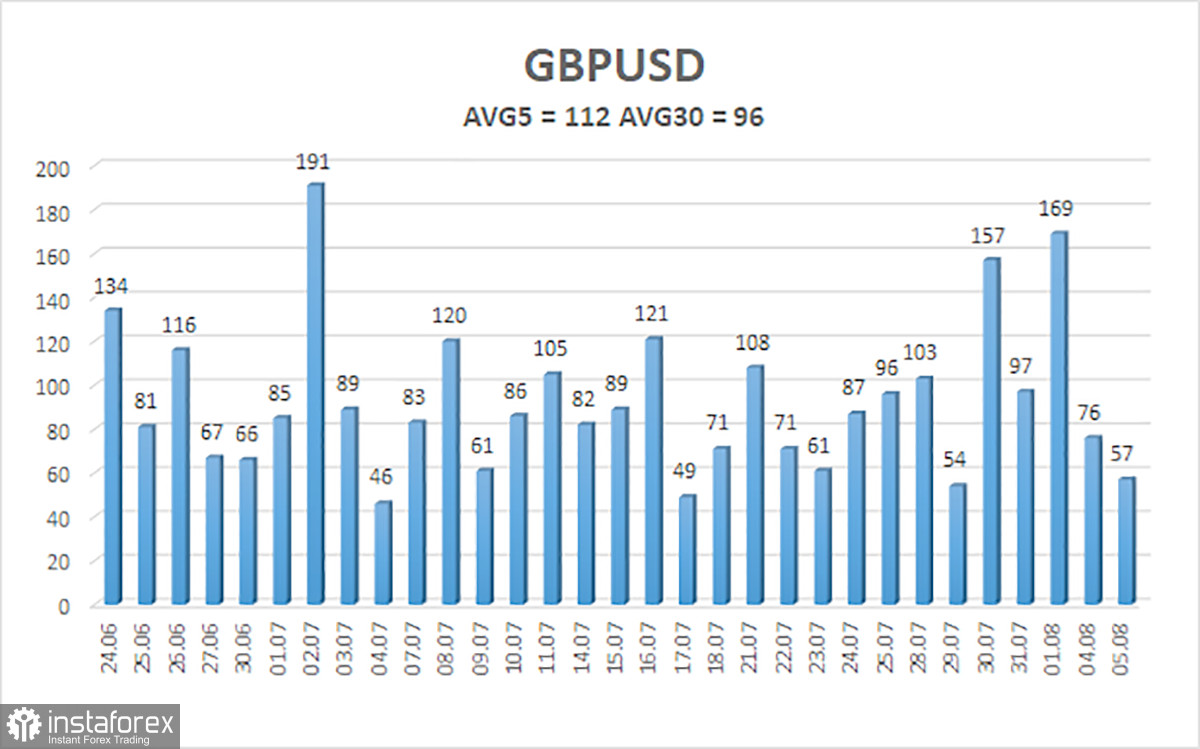
The average volatility of the GBP/USD pair over the past five trading days stands at 112 pips. For the pound/dollar pair, this is considered "high." On Wednesday, August 6, we expect movement within the range defined by levels 1.3179 and 1.3403. The long-term linear regression channel is pointing upward, clearly indicating an uptrend. The CCI indicator has entered the oversold area twice, signaling a possible resumption of the upward trend. At present, a new corrective phase is underway.
Nearest Support Levels:
S1 – 1.3245
S2 – 1.3184
S3 – 1.3123
Nearest Resistance Levels:
R1 – 1.3306
R2 – 1.3367
R3 – 1.3428
Trading Recommendations:
The GBP/USD currency pair continues its downward correction for now. In the medium term, Trump's policies are likely to continue putting pressure on the dollar. Therefore, long positions with targets at 1.3550 and 1.3611 remain more relevant if the price stays above the moving average. If the price falls below the moving average, small short positions may be considered with targets at 1.3184 and 1.3179 based purely on technical factors. Occasionally, the U.S. dollar does experience corrections, but for a sustained strengthening trend, evident signs of the end of the global trade war are needed, which now seems unlikely.
Explanation of Illustrations:
Linear Regression Channels help determine the current trend. If both channels are aligned, it indicates a strong trend.
Moving Average Line (settings: 20,0, smoothed) defines the short-term trend and guides the trading direction.
Murray Levels act as target levels for movements and corrections.
Volatility Levels (red lines) represent the likely price range for the pair over the next 24 hours based on current volatility readings.
CCI Indicator: If it enters the oversold region (below -250) or overbought region (above +250), it signals an impending trend reversal in the opposite direction.