Analysis of Monday's Trades
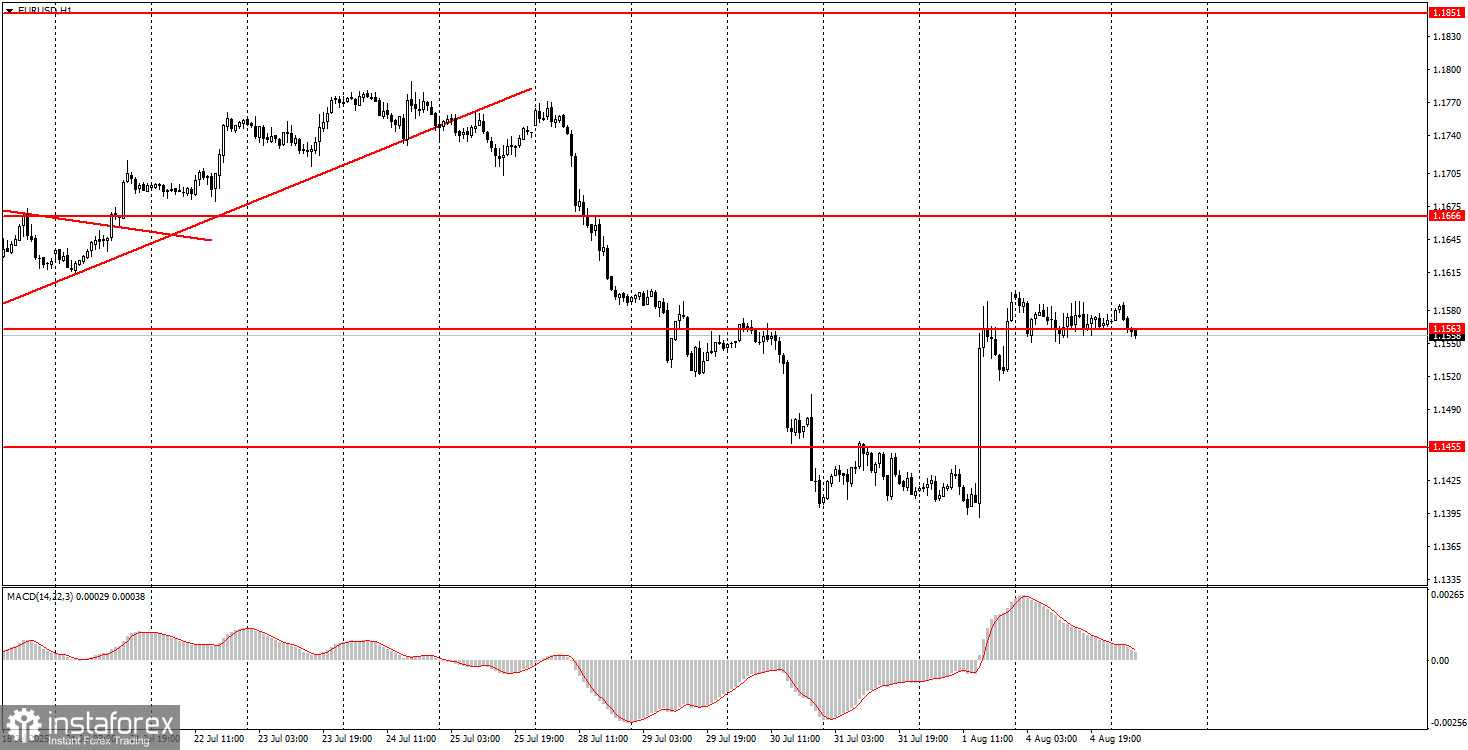
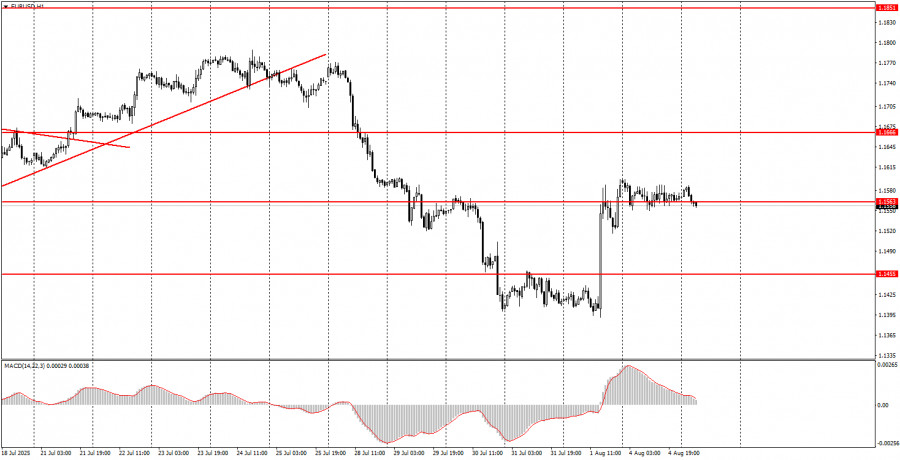
1H Chart of EUR/USD
The EUR/USD currency pair traded strictly sideways on Monday, with minimal volatility. We had expected the market to continue reacting to Friday's events, but traders decided to take a pause — which, of course, is understandable. There were absolutely no significant news releases on Monday. In our view, the overall technical picture still suggests further upward movement. The poor U.S. labor market and unemployment data, along with new tariffs and sanctions introduced by Donald Trump, essentially indicate both the negative impact of the trade war on the economy and a new escalation of the trade conflict. Therefore, we believe that the broader situation and global fundamental backdrop have not changed recently. The U.S. dollar had been rising for several weeks on technical grounds, driven by Trump's signing of several favorable trade agreements and a solid Q2 GDP report. However, the labor market data have revealed the flip side of Trump's policy. His political interference in the operations of the Bureau of Labor Statistics and the Federal Reserve also plays an important role in shaping the dollar's exchange rate.
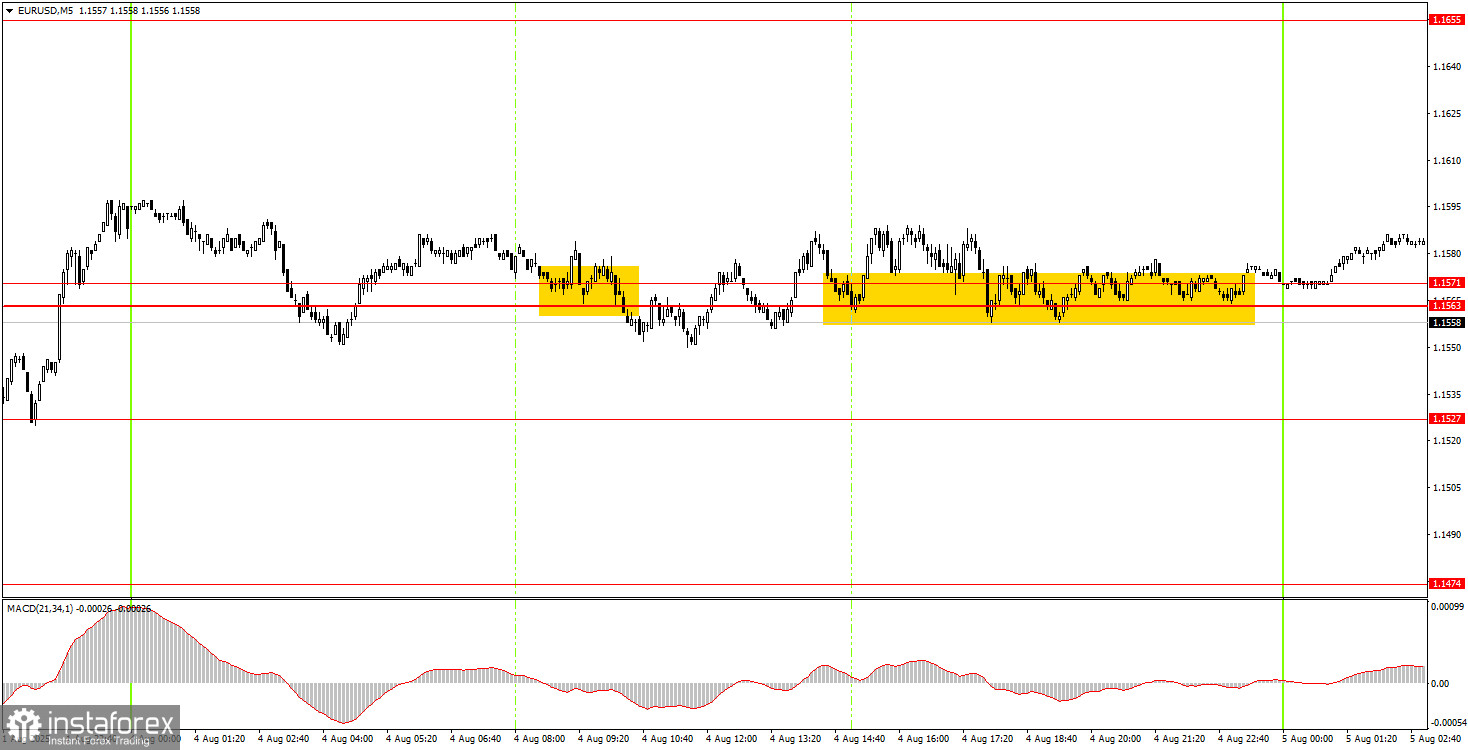
5M Chart of EUR/USD
On the 5-minute timeframe, the price moved only sideways on Monday, hovering around the 1.1563–1.1571 range. As a result, there were many potential signals during the day. Naturally, all of them turned out to be false, but it was already clear during the European session that we were in for a total flat market.
Trading Strategy for Tuesday:
On the hourly timeframe, EUR/USD has every chance of resuming the upward trend that has been forming since the beginning of the year. The "house of cards" for the U.S. dollar has collapsed. We had previously warned that there were no long-term grounds for dollar appreciation and had expressed doubts about the "optimism" surrounding Trump's policies and their initial results. Friday confirmed that our skepticism was justified.
On Tuesday, the EUR/USD pair may resume its northward movement. After a well-deserved rest on Monday, the market is ready to continue getting rid of the U.S. currency. In addition to the dismal labor market report, we also note a new batch of tariffs from the generous American president — along with a fresh round of threats. We believe the dollar will continue to weaken. As a support zone from which growth may resume, we suggest using the 1.1552–1.1571 area.
On the 5-minute chart, watch the following levels: 1.1198–1.1218, 1.1267–1.1292, 1.1354–1.1363, 1.1413, 1.1455–1.1474, 1.1527, 1.1552–1.1563–1.1571, 1.1655–1.1666, 1.1740–1.1745, 1.1808, 1.1851, 1.1908.
There are no important events scheduled in the eurozone on Tuesday. However, the U.S. ISM Services PMI, a key business activity index, will be released.
Core Trading System Rules:
- Signal Strength: The shorter the time it takes for a signal to form (a rebound or breakout), the stronger the signal.
- False Signals: If two or more trades near a level result in false signals, subsequent signals from that level should be ignored.
- Flat Markets: In flat conditions, pairs may generate many false signals or none at all. It's better to stop trading at the first signs of a flat market.
- Trading Hours: Open trades between the start of the European session and the middle of the US session, then manually close all trades.
- MACD Signals: On the hourly timeframe, trade MACD signals only during periods of good volatility and a clear trend confirmed by trendlines or trend channels.
- Close Levels: If two levels are too close (5–20 pips apart), treat them as a support or resistance zone.
- Stop Loss: Set a Stop Loss to breakeven after the price moves 15 pips in the desired direction.
Key Chart Elements:
Support and Resistance Levels: These are target levels for opening or closing positions and can also serve as points for placing Take Profit orders.
Red Lines: Channels or trendlines indicating the current trend and the preferred direction for trading.
MACD Indicator (14,22,3): A histogram and signal line used as a supplementary source of trading signals.
Important Events and Reports: Found in the economic calendar, these can heavily influence price movements. Exercise caution or exit the market during their release to avoid sharp reversals.
Forex trading beginners should remember that not every trade will be profitable. Developing a clear strategy and practicing proper money management are essential for long-term trading success.